Published 20 September 2022.
GDPR statement: Please note that the author of this blog does not set cookies but the host “wordpress.com” sets multiple cookies which are outside of the authors control. You can view their cookie policy here.
A: Overview
1. Influences.
Changes in sea temperature
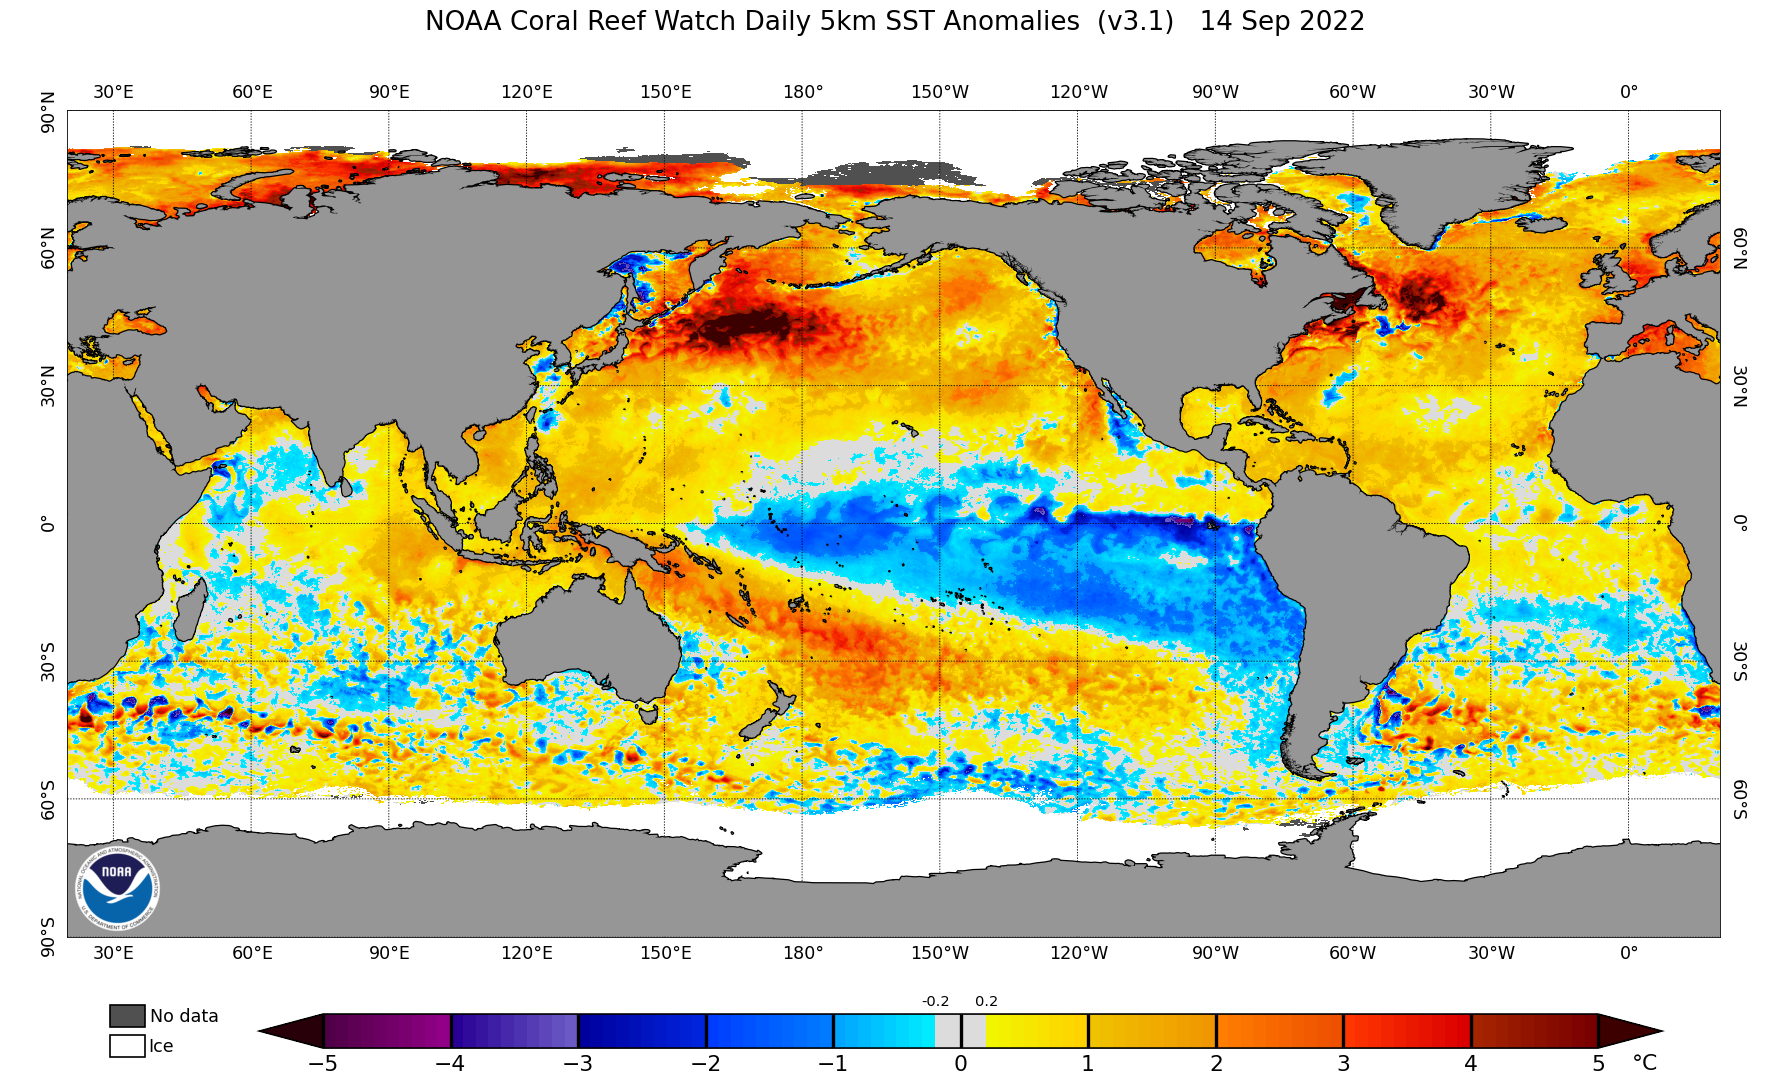
Sea temperature anomalies in most of the Northern Hemisphere are much warmer than climatology for the middle of September. The area of colder than average temperatures southwest of Portugal have warmed out which may account for the recent increase in Atlantic tropical cyclone activity, although this is normally a time when increased activity is present. Mediterranean temperatures have been high enough for tropical storm type formation. Pacific Ocean anomalies are similar to last month.


The Tropical Atlantic sea temperature anomalies remain warmer than average and are forecast to remain slightly warmer through most of the winter. (see Met Office graphic below). (NOTE last month Indian Ocean graphic was used in error)

Forecasts suggest that tropical Pacific Sea Surface Temperatures (nino3.4) are likely to have similar anomalies through the autumn with weak La Nina conditions forecast to persist. A trend to Neutral conditions is possible later in the winter 2022/23 and perhaps an El Nino for Spring 2023, although there is not a great deal of support for the CFS forecast.

The North Atlantic Oscillation index (500hPa index shown below) has been uncertain/slightly positive recently. The ensemble forecast is for negative conditions to develop although GFS operation model is not so convinced. (CORRECTION) Negative values imply WEAKER westerly winds across the Atlantic towards Europe although a weak signal is inconclusive.
Seehttps://www.metoffice.gov.uk/weather/learn-about/weather/atmosphere/north-atlantic-oscillation
“The negative NAO phase represents the reverse with a weaker than usual difference in pressure.
Winds from the east and north-east are more frequent, bringing with them cold air, while the adjusted position of the jet stream leads to weaker and less frequent storms.
As a result, Europe and eastern US are more likely to experience cold, calm and dry winters. In contrast, northern Canada and Greenland will tend to be mild and wet.”

2. Recent Climatology
SW England: Up to the 15th of September. Temperature was above average for the month with anomalies of 2 or 3ven 3 degrees Celsius. Rainfall was average or above average across SW England but sunshine was about half of what might be expected so far in September.
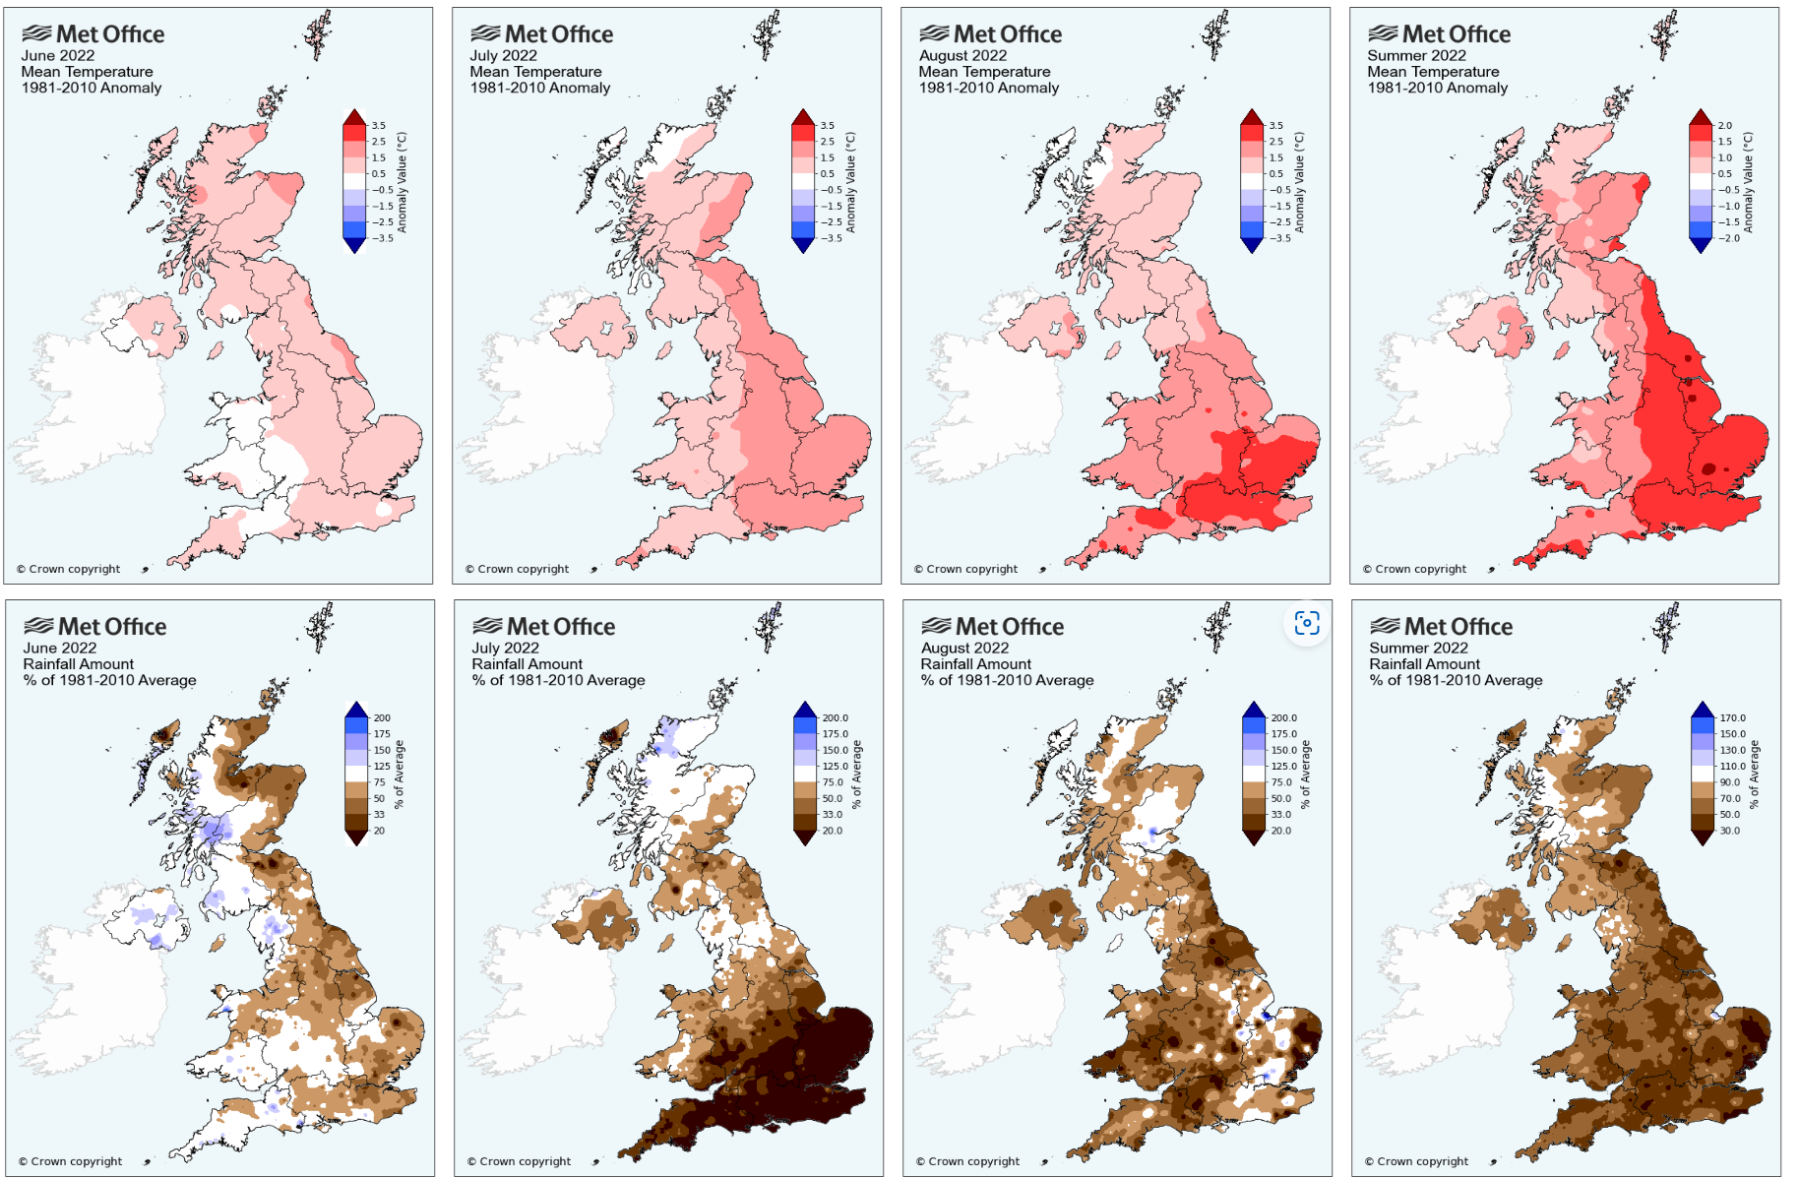
UK:
Met Office provisional Temperature and Rainfall anomalies for June, July, August 2022 are shown below: Rainfall in July was a record low across southern and SE England and in some central and southern parts of the UK record high temperatures also occurred.

Copernicus, European temperature and rainfall anomalies and soil moisture for August 2022 and the Summer (June to August 2022) compared with 30 year period 1981-2010.
UK River flows and ground water levels in August 2022 reflected the very dry weather and were well below average. Details can be found in the August 2022 Hydrological Summary

From the nrfa.ceh.ac.uk UK water resource portal. River flow data as of 18th September 2022 (shown below) shows some recovery from the exceptionally low flows in August.

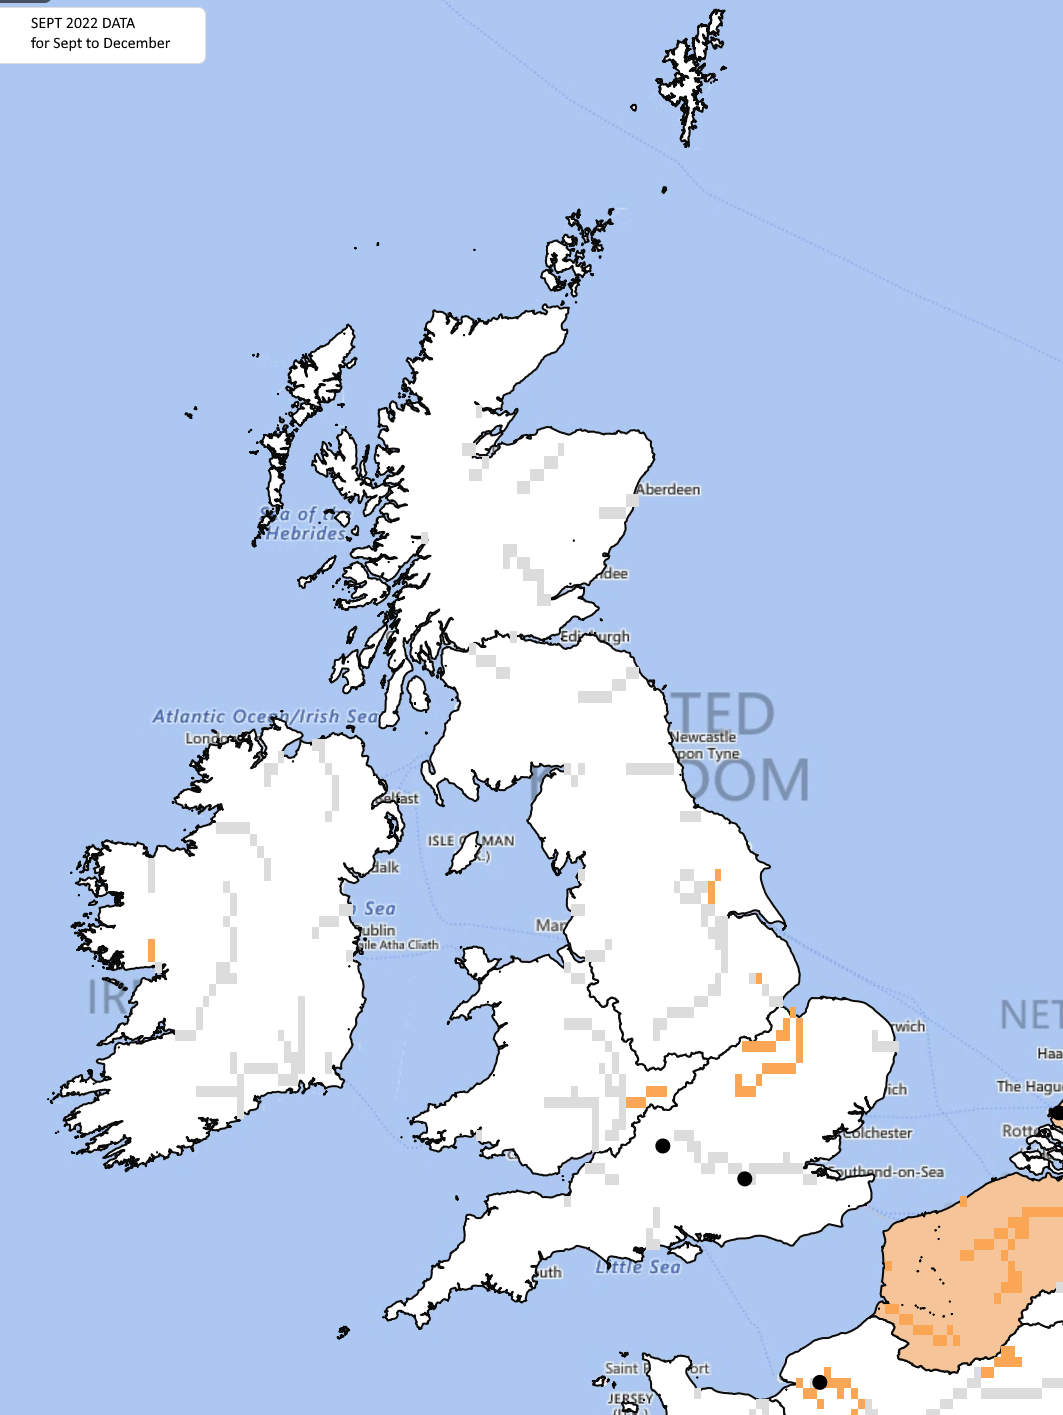
Global Flood Awareness System – GloFAS – flood risk for September to December suggests that the river flood risk is average or below average across the UK, due to low ground water values. This does not include “flash” floods caused for example by localised heavy rain which with dry soils can lead to increased run off.
Reservoir levels, according to SW Water, are below the long term average across SW England as of 4th September 2022 (not sure why this has not been updated). The Environment Agency previously confirmed drought status in 14 areas of the UK including: Devon and Cornwall.

B: Forecast data:
1. Stratosphere:
The stratosphere remains in “summer” mode across the N Pole. In the South there is a strong stratospheric vortex and marked ozone hole.

2. Upper troposphere:
CFSv2 200hPa contours (top row) and CFSv2 anomaly (lower row) for October November December 2022. The higher than average heights forecast could be due to higher than average temperatures in depth through the atmosphere?

3. Lower Troposphere:
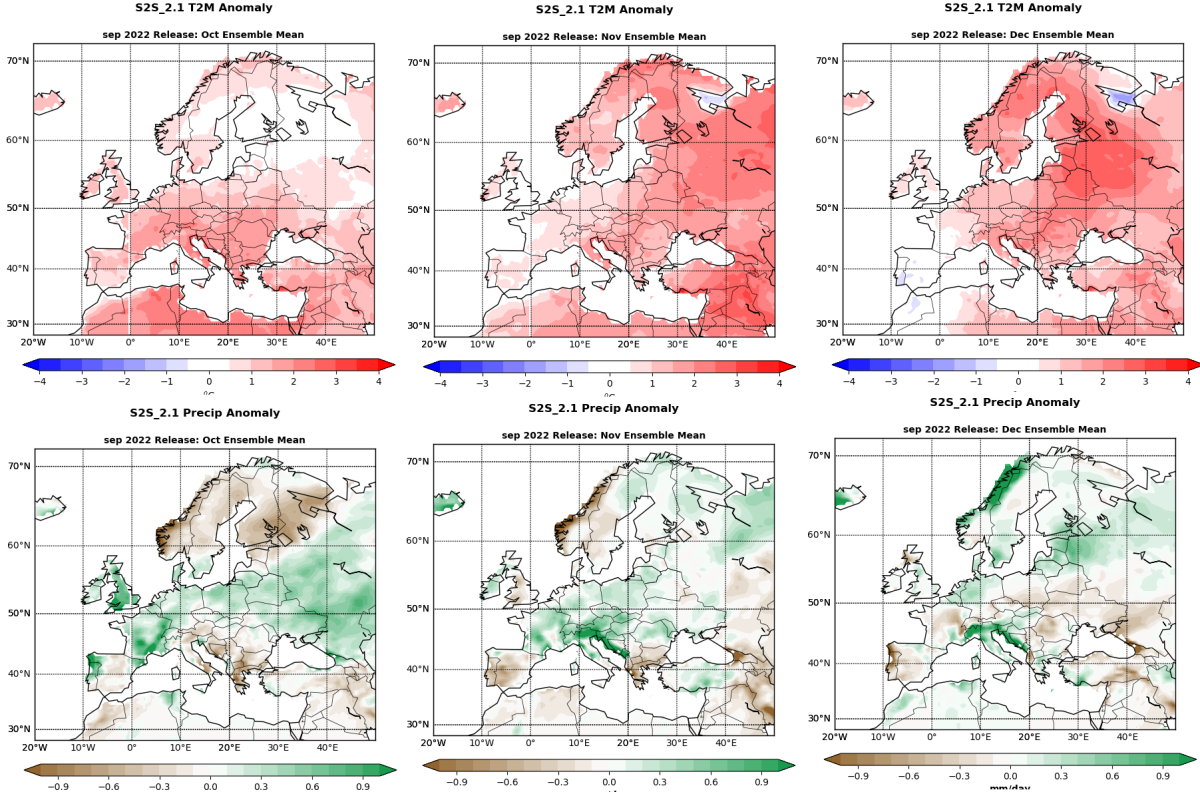
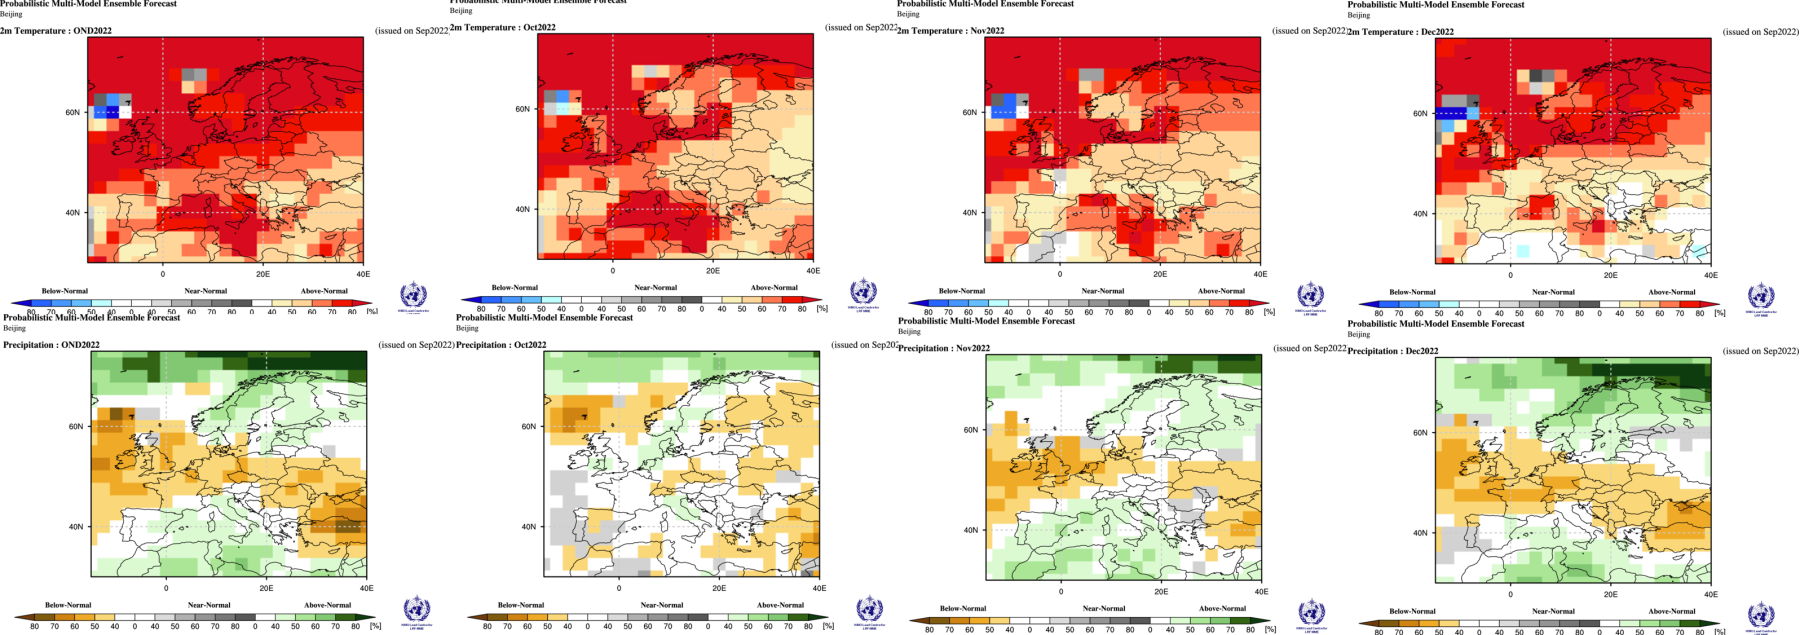
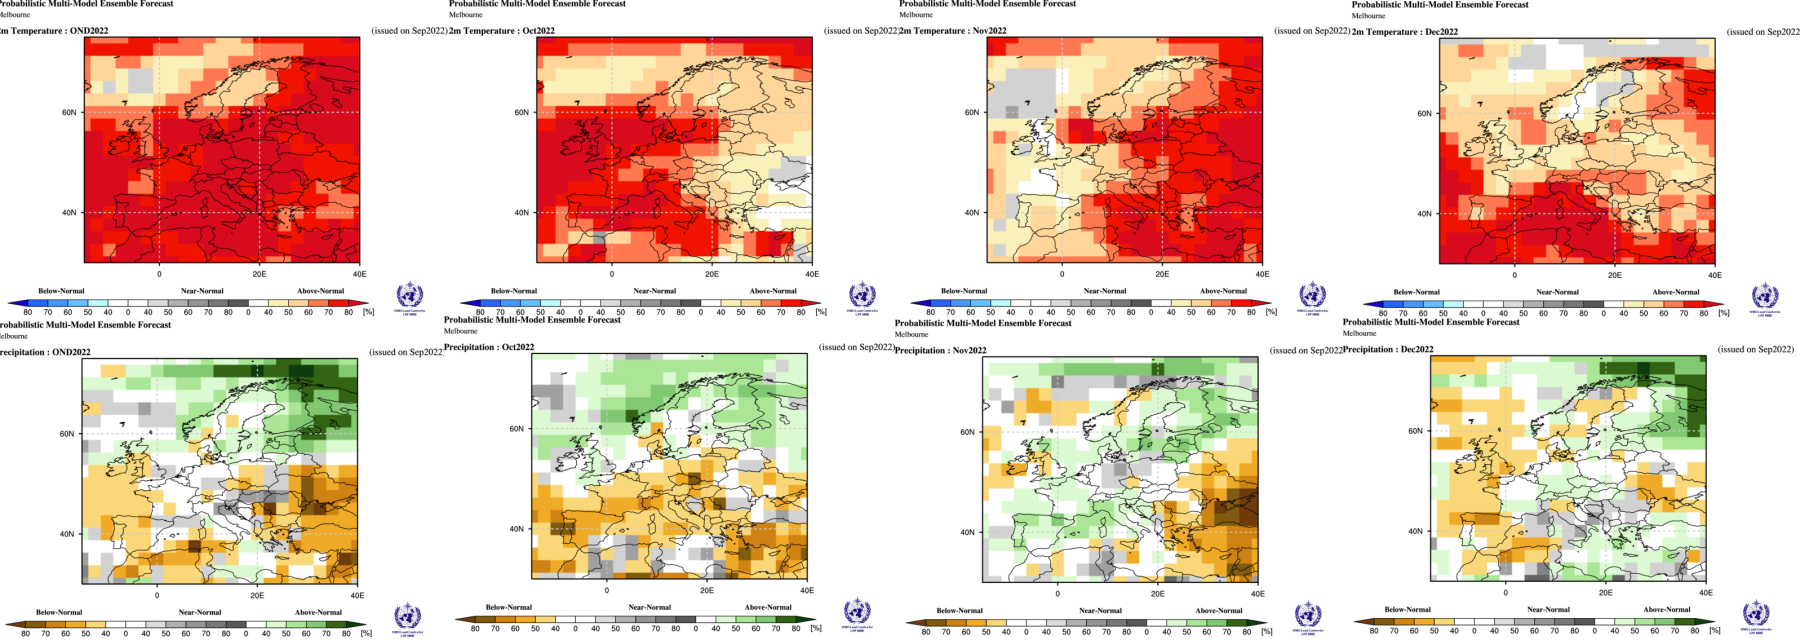
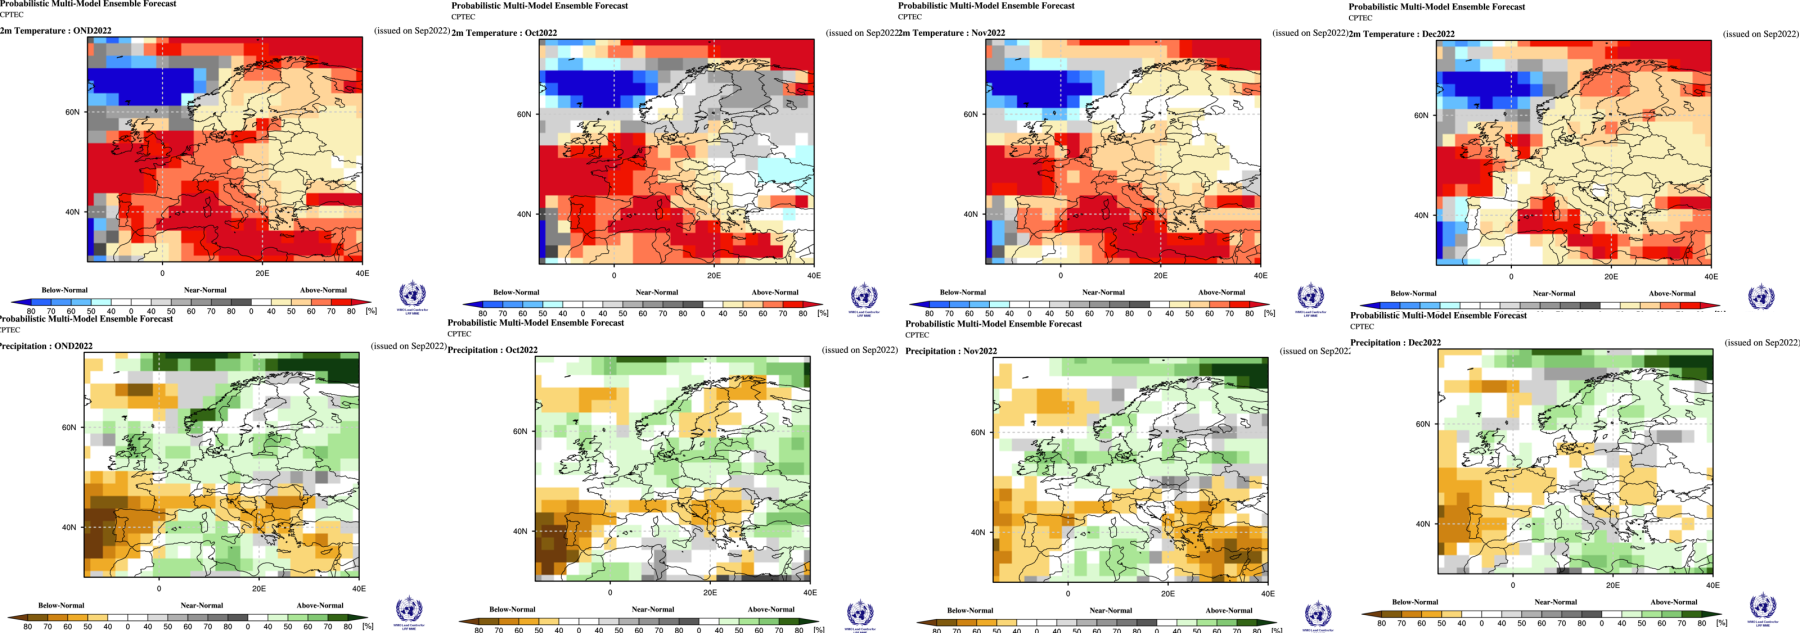
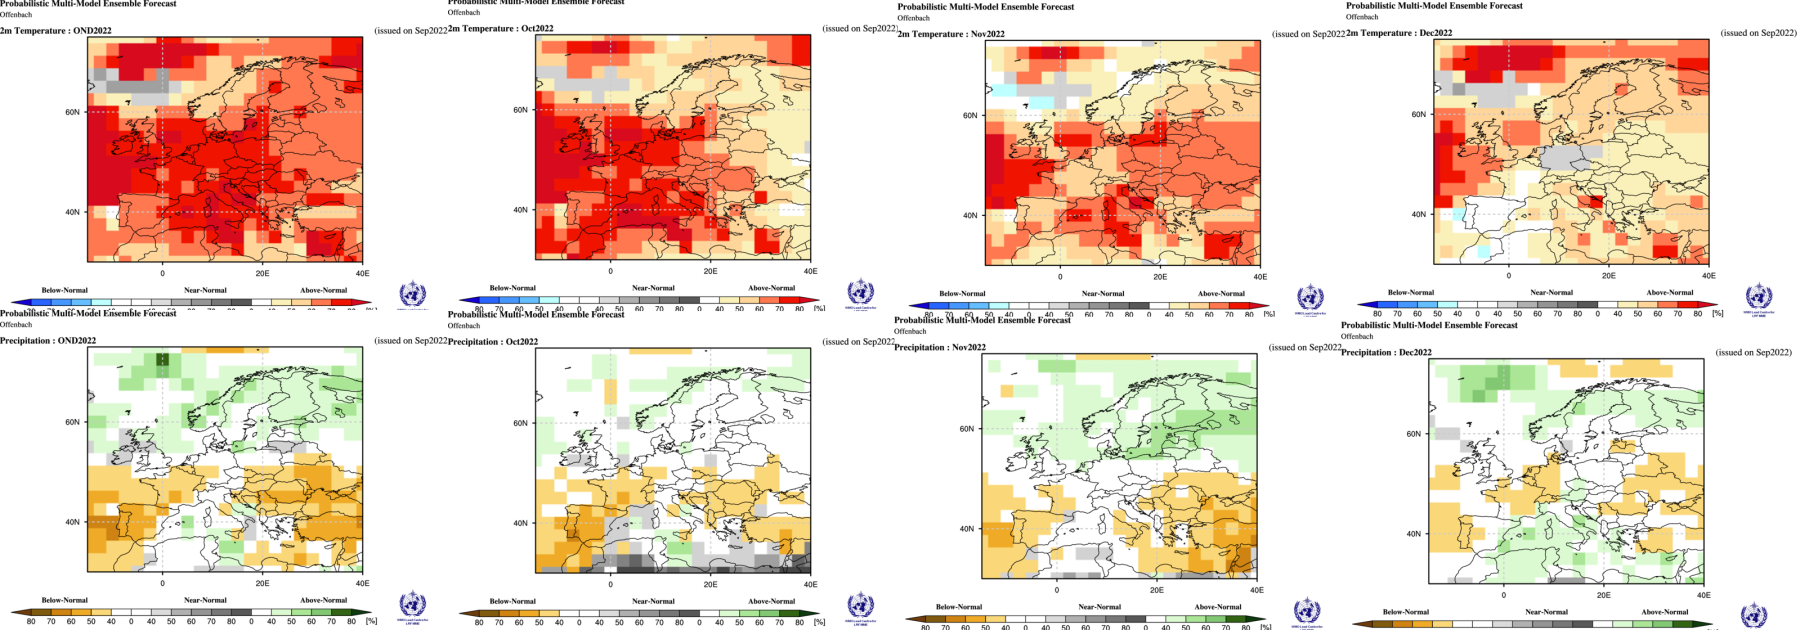
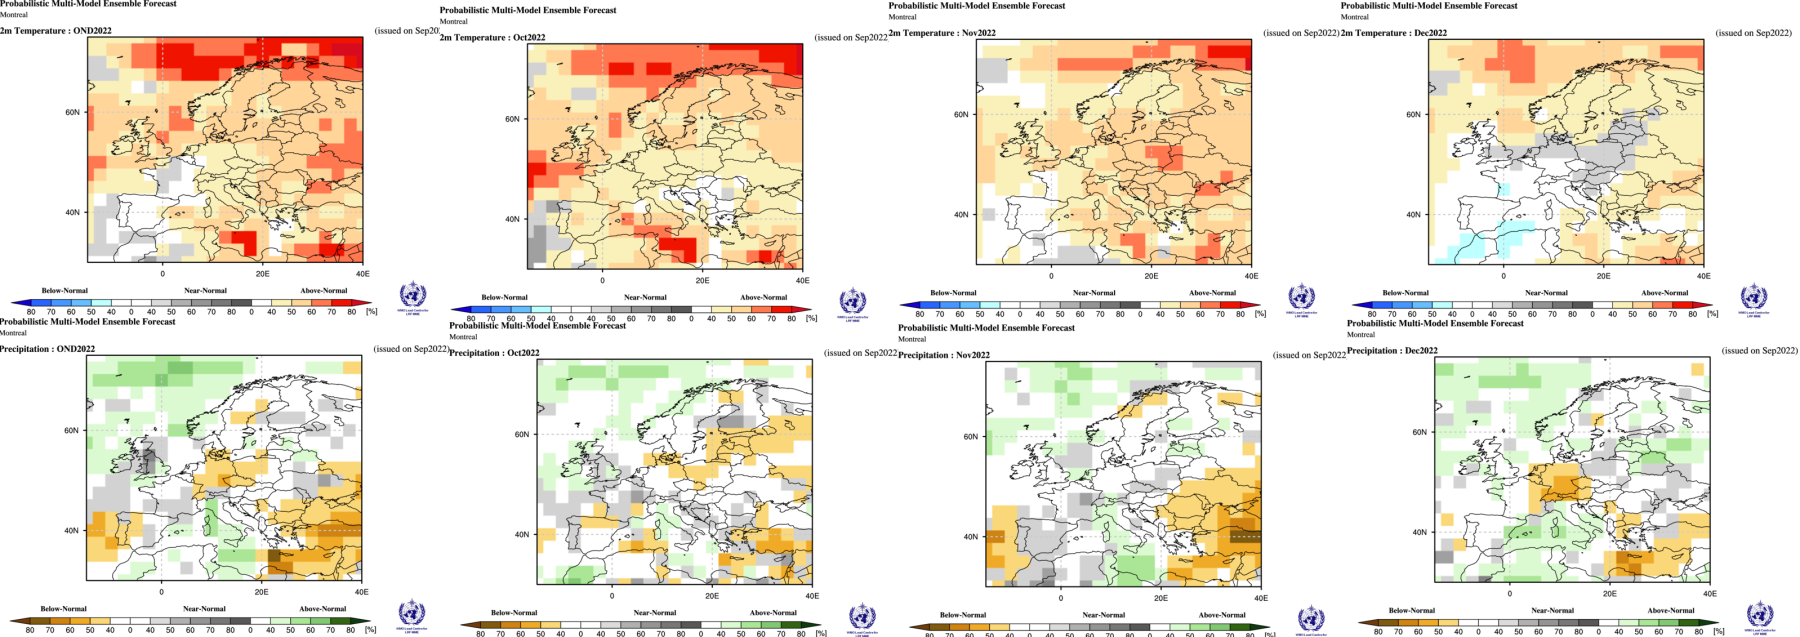
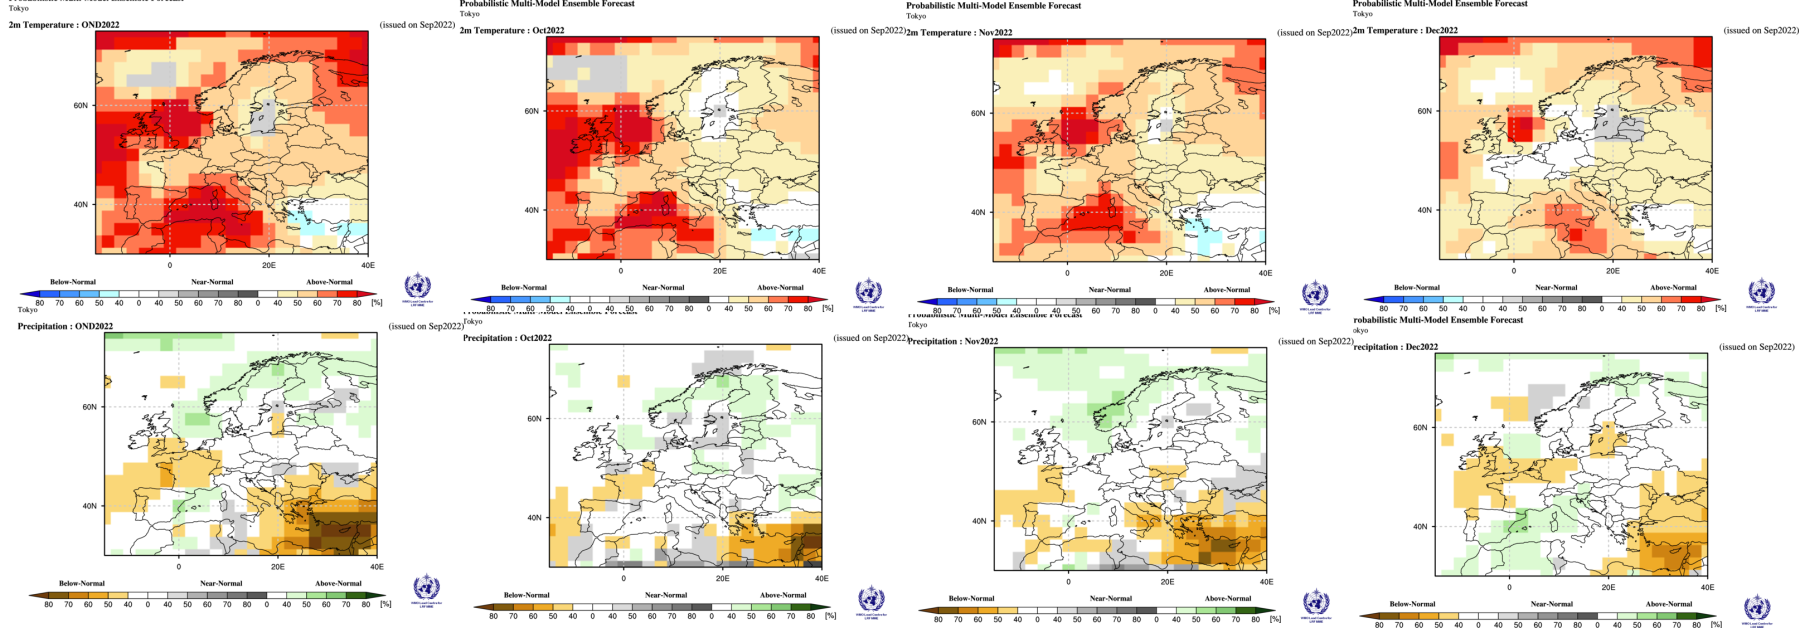
Selection of model solutions for October to December 2022 using September data are shown below.
Other graphics can be viewed at http://www.weather-info.co.uk/wxsvc/seaslatest.html
Top row temperature anomaly and lower row precipitation anomaly


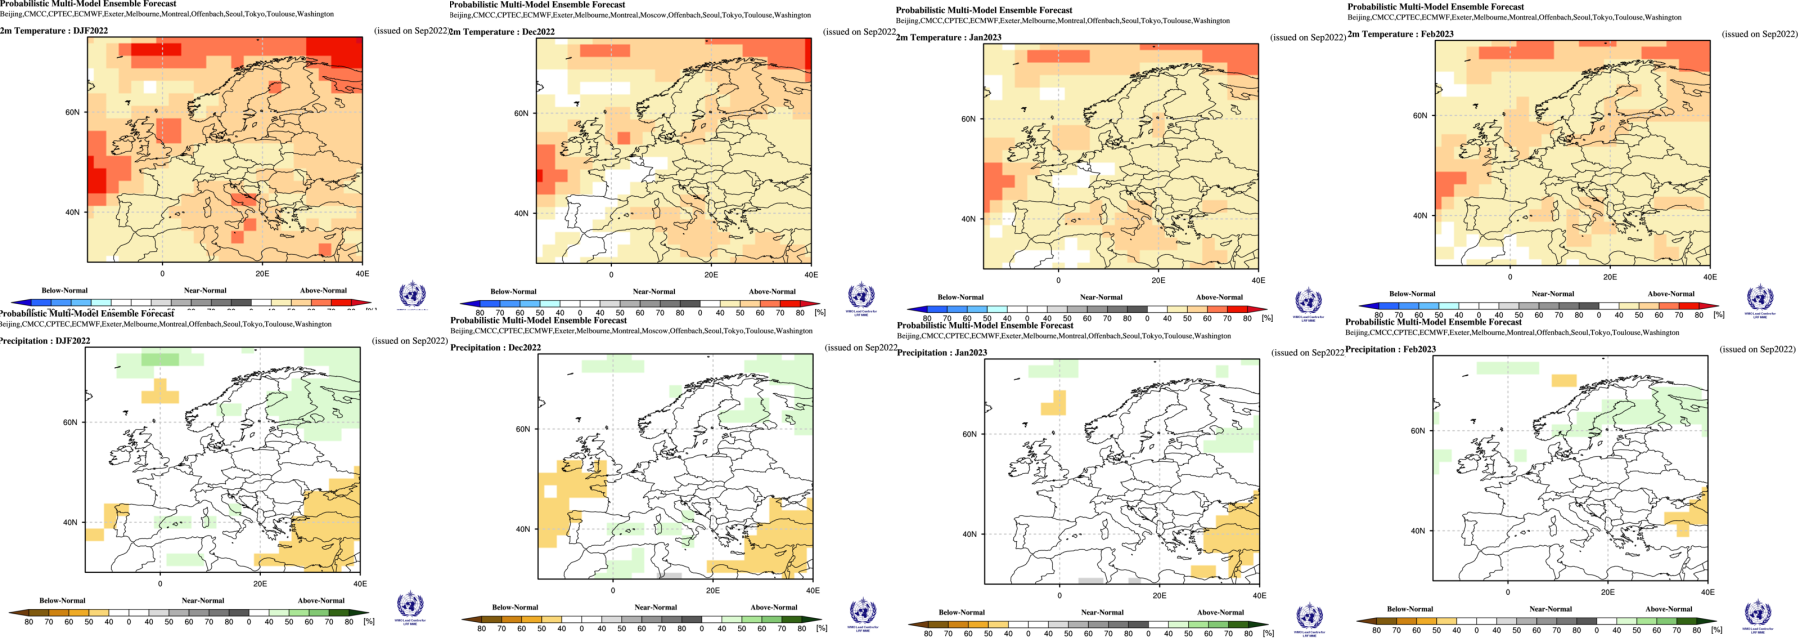
ource Data WMO low resolution super ensemble for August to October 2022 based on July data. Full data at http://www.weather-info.co.uk/wxsvc/seaslatest.html
Top row temperature anomaly and lower row precipitation anomaly. Left image three month mean then individual months.


Available Graphics for Winter (December 2022 / January and February 2023) can be seen at http://www.weather-info.co.uk/wxsvc/seaslatest.html Previous issues are available by following link on the web page.
C: Comparing previous output:
June to August 2022 – based upon May 2022 data.
Original Summary -Summary – 170522 –
Temperature: all models suggest “summer” will have above average temperatures. A few models suggest either June or July could be near average. Typical values suggested 0.5 to 1C above average locally 1 to 2C in south and 0.2 to 0.5C in the north.
Rainfall: Main theme seems to be increased chance of below average rainfall in the south and above average in the N or NW of Scotland. Elsewhere near normal although August might be see above average rainfall in the south after a drier July.
Pressure: near normal perhaps below in the north early on and below in the south later in the season.
Comment: Temperature forecast good anomalies over 2 C in parts of S and E. Rainfall good indication including idea of July being drier than August in parts of the south. Pressure indication poor.
Scoring will attempt to state good, fair, poor or no signal.
Revised order
1. Russia (WMO): Temp fair . PPN poor .
2. USA – CFS2 : Temp good . PPN poor .
3. UKMO Contingency: Temp fair . PPN poor .
4. UKMO : Temp good . PPN poor . PMSL poor
5. USA – IRI : Temp fair . PPN poor .
6. KMA APCC : Temp good . PPN no signal – fair in S .
7. JMA : Temp good . PPN good . PMSL poor
8. NMME : Temp good . PPN poor .
9. WMO multi : Temp good . PPN fair .
10. BCC : Temp good . PPN good .
11. NASA : Temp good . PPN poor .
12. CanSips : Temp good . PPN almost good .
13. Copernicus Temp good . PPN fair . PMSL poor
14. CMCC Temp good . PPN poor . PMSL poor
15: DWD Temp good . PPN poor almost fair . PMSL poor
16. EC Temp good . PPN fair . PMSL poor
17 JMA Temp good . PPN fair . PMSL poor
18 UKMO Temp good . PPN fair . PMSL poor
19. MF Temp good . PPN fair . PMSL fair
20 NCEP Temp good . PPN poor . PMSL poor
21 ECCC Temp: good. PPN fair . PMSL poor
22 ECMWF monthly Temp: good. PPN fair almost good .
WMO low res data: 3 month average
BoM Temp good. PPN poor.
Can Temp good. PPN good.
DWD Temp good. PPN fair.
KMA Temp good. PPN fair.
MOSC Temp good. PPN poor.
WASH Temp good. PPN poor.
CMA Temp good. PPN fair.
ECMWF Temp good. PPN fair.
UK Temp good. PPN poor.
JMA Temp good. PPN good
MF Temp good. PPN almost good.
CMCC Temp good. PPN fair.
CPTEC Temp good. PPN good .
D: Text Forecast for SW England
Remainder of Autumn 2022 (October November).
Strong indication for above normal temperature values for both months.
Rainfall, October probably well above normal with near normal values likely in November.
Autumn climate: 1981 to 2010 average mean temperature 11 or 12°C but nearer 10°C in rural areas. Maximum temperatures average 14 to 16°C. November normally colder than October. Average 1981 to 2010 rain 300 to 400mm, 600 to 800mm over the moors but east of the moors and in lowland Somerset more like 200 to 300mm.
Winter 2022/23 (December January February). Very limited data.
Temperature forecasts continue to suggest a milder than average winter although December may only be slightly above.
Rainfall forecast is for near average for the season although some western exposures may have above average values. January could be wetter than average. Some models suggest much wetter than normal but these are balanced by the drier than average solutions. Snowfall likely to be below average, which means little if any snow for lower ground but some snow over the moors.
Winter Climate: 1981-2010 average temperature values for lowland areas 7°C in the West and 5°C in the East. Rainfall; Dec and Jan typically wetter than February. 1981-2010 Autumn average 300-400 mm lowlands but 200-300 mm areas to E of Dartmoor. Snow climatology less than 5 days lying snow over lowland areas 5 to 10 hills, say hills around 200 metre elevation – one in three years have no lying snow.
Spring (2023 March April May)
Overall milder than average temperatures and near or above average rainfall
Spring climate: 1981-2010 average mean temperature 9 or 10°C but a few degrees cooler over the moors. Roughly Mar 7 or 8°C Apr 8 or 9°C May 11 or 12°C. Average 1981 to 2010 rain 200 to 300mm lowest values in E Devon and over parts of Somerset
E. Caution.
Experimental Long Range Forecasts do not have a good success rate. The data used for the above forecast summary can be seen at here.
The attempt at a Regional Forecast for SW England aims to test whether such a forecast of temperature and rainfall variation from average can be made using numerical model data available on the internet. The forecast should not be used for any other purpose. A brief verification summary for the UK and Eire is routinely published at http://www.weather-info.co.uk/wxsvc/Verification.html or Click here for the Teignmouth and Dawlish summary
F: References.
SST anomaly NOAA Remote Sens. 2014, 6(11), 11579-11606; doi:10.3390/rs61111579
IRI statistics: Mason, S.J. and L. Goddard, 2001: Probabilistic precipitation anomalies associated with ENSO. Bull. Amer. Meteor. Soc., 82, 619-638.
UK climate details see: http://www.metoffice.gov.uk/public/weather/climate/
NMME information: http://journals.ametsoc.org/doi/abs/10.1175/BAMS-D-12-00050.1
CFS2 info
GLOFAS Acknowledgement: Data were provided by the Global Flood Awareness System – GloFAS (http://www.globalfloods.eu/) of the European Commission Joint Research Centre and the European Centre for Medium-Range Weather Forecasts.
Reference: Alfieri, L., Burek, P., Dutra, E., Krzeminski, B., Muraro, D., Thielen, J., and Pappenberger, F.: GloFAS – global ensemble streamflow forecasting and flood early warning, Hydrol. Earth Syst. Sci., 17, 1161-1175, doi:10.5194/hess-17-1161-2013, 2013.
‘Copernicus Products’ as listed in the C3S or CAMS Service Product Specification or any other items available through an ECMWF Copernicus http://climate.copernicus.eu
International seasonal monthly data from WMO
Stratospheric Diagnostics from Japan Met Agency and ECMWF via Free University Berlin
Climate data from The Met Office UK and NCEP USA
Contains public sector information licensed under the Open Government Licence v3.0.
