Published 23 April 2024
GDPR statement: Please note that the author of this blog does not set cookies but the host “wordpress.com” sets multiple cookies which are outside of the authors control. You can view their cookie policy here.
A: Overview
1. Influences.
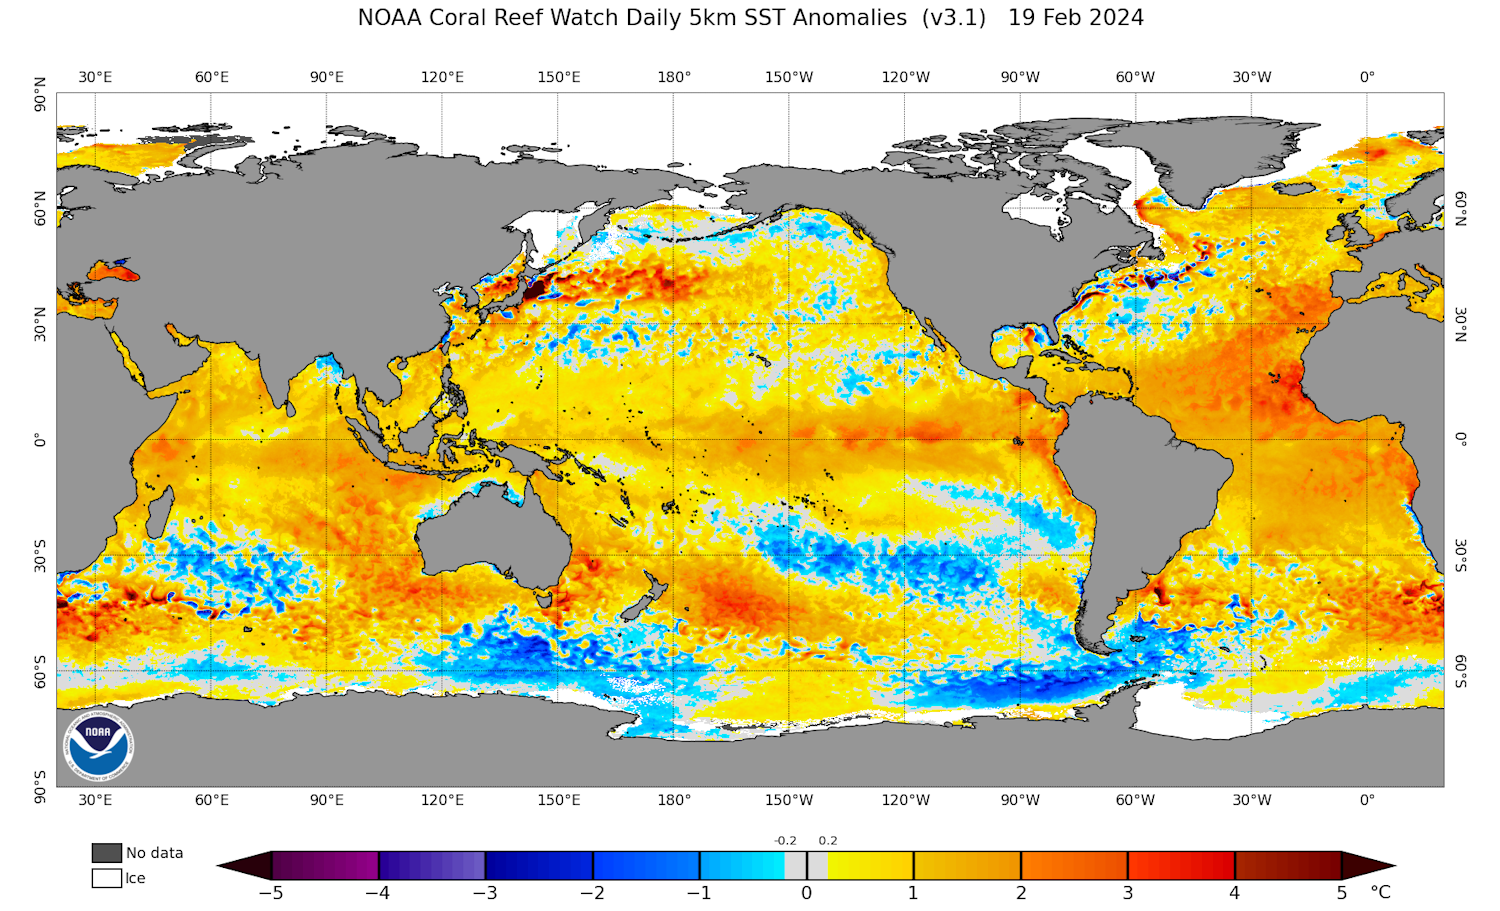
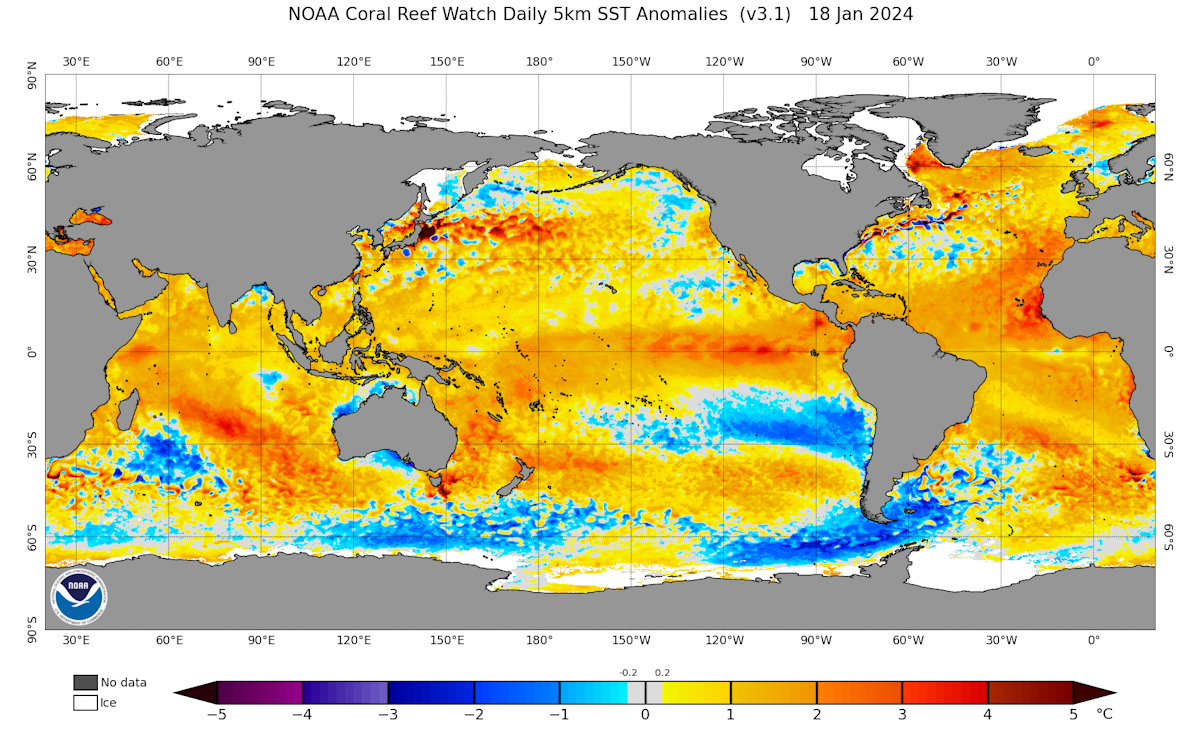
Changes in sea temperature

Sea temperature anomalies across the North Atlantic remain warmer than climatology for the middle of April. Areas around the south of the UK, Europe, Mediterranean show 1 or 2 Celsius positive anomalies. Pacific ocean anomalies along the equator show a weakening El Nino state and the tropical Atlantic looks to have similar anomalies to those in March.
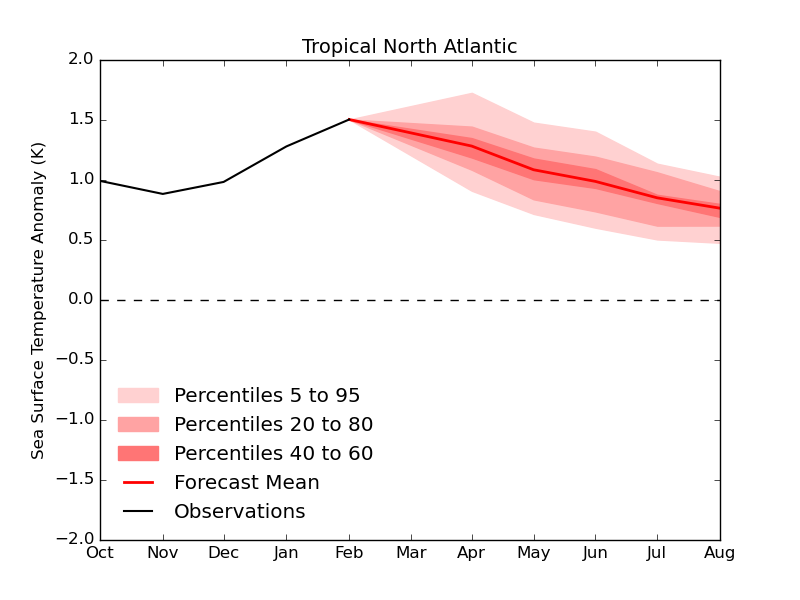
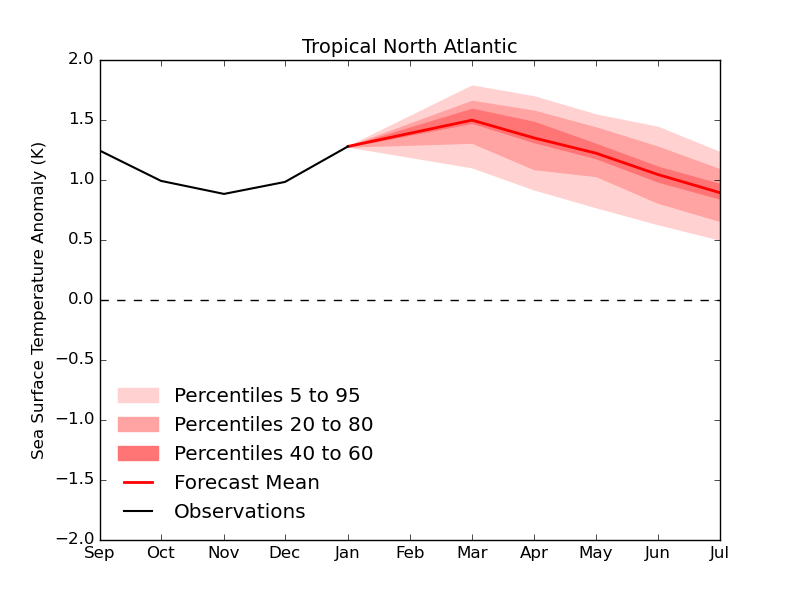
The Tropical Atlantic sea temperature anomalies are warmer than average and are forecast to maintain positive anomalies through Summer and into Autumn 2024. (see Met Office graphic below).

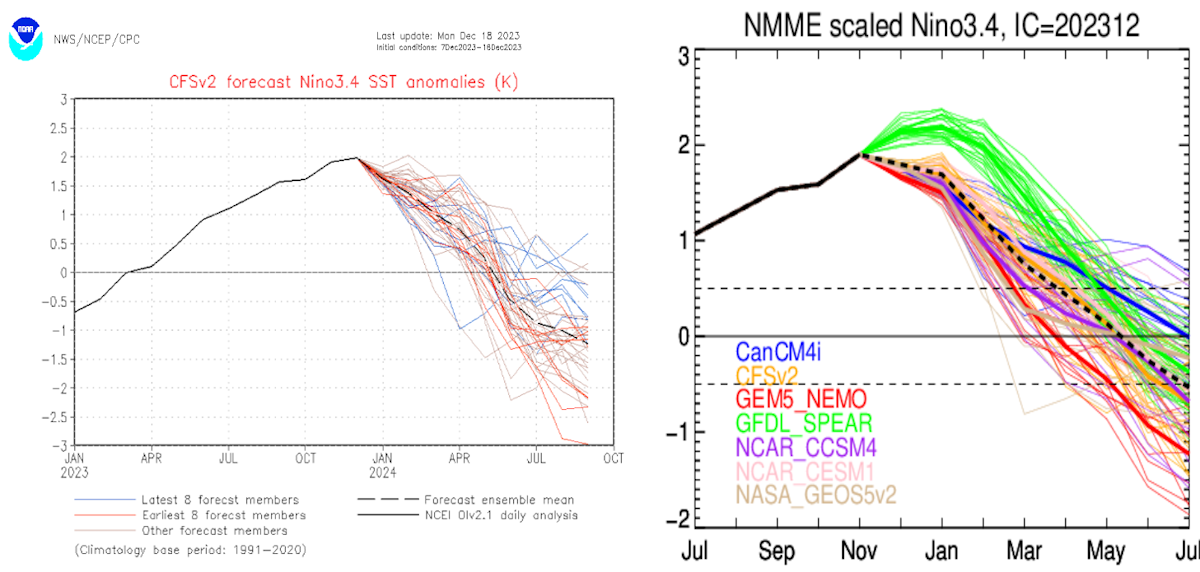
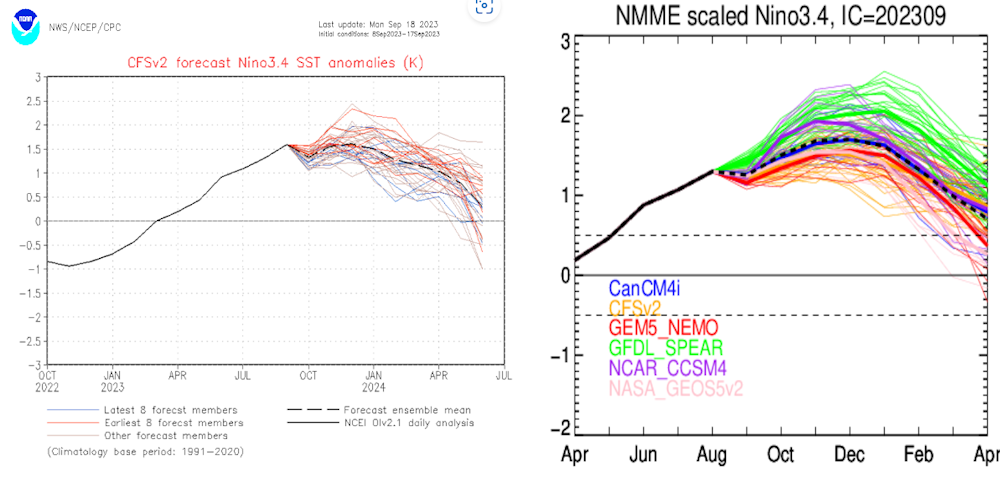
Tropical Pacific Sea Surface Temperatures (Nino3.4) show a quickly weakening El Nino state and forecast to become neutral during by the start of May becoming La Nina during the Summer. Indication are for the formation of a strong La Nina in the second half of 2024.

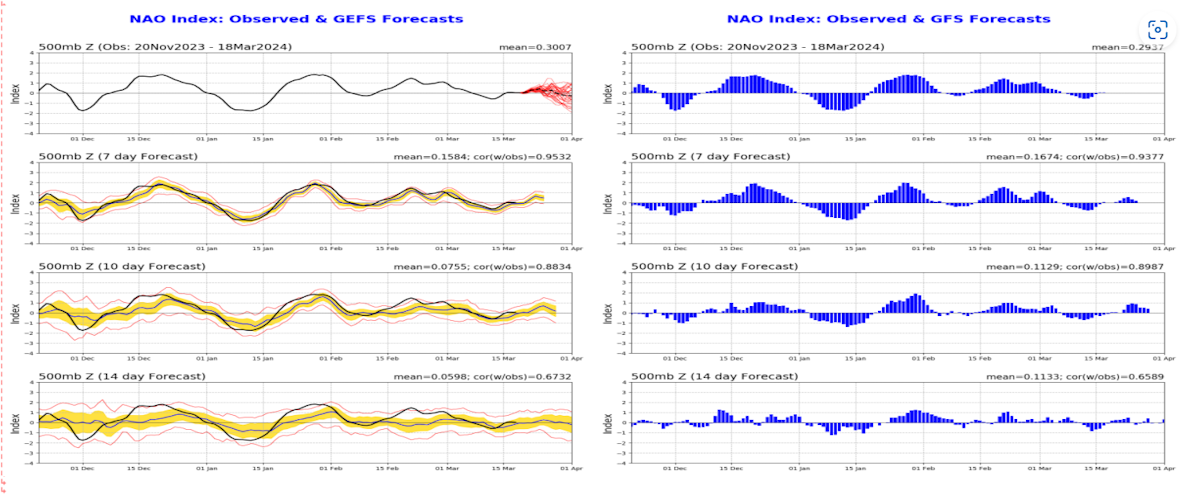
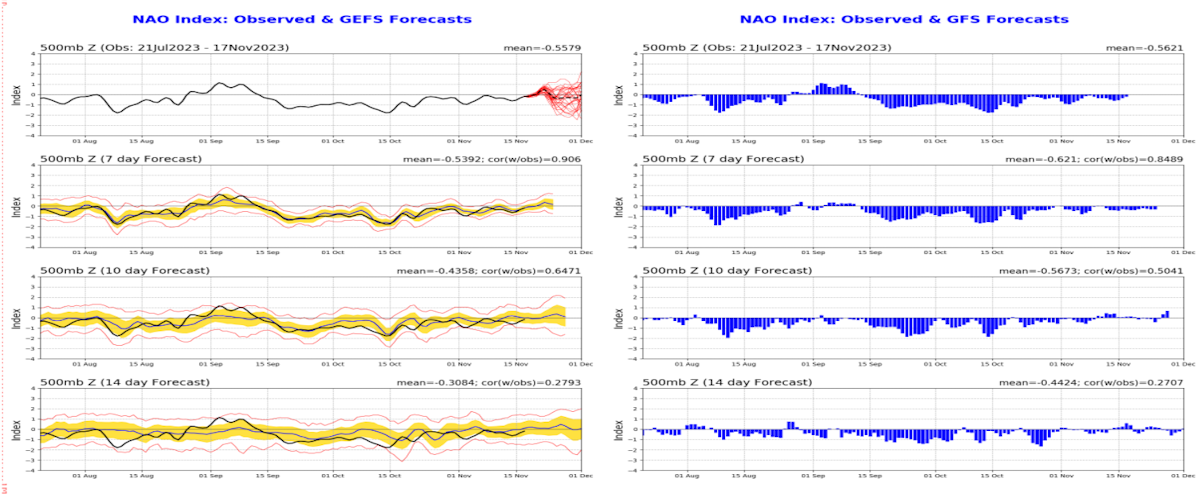
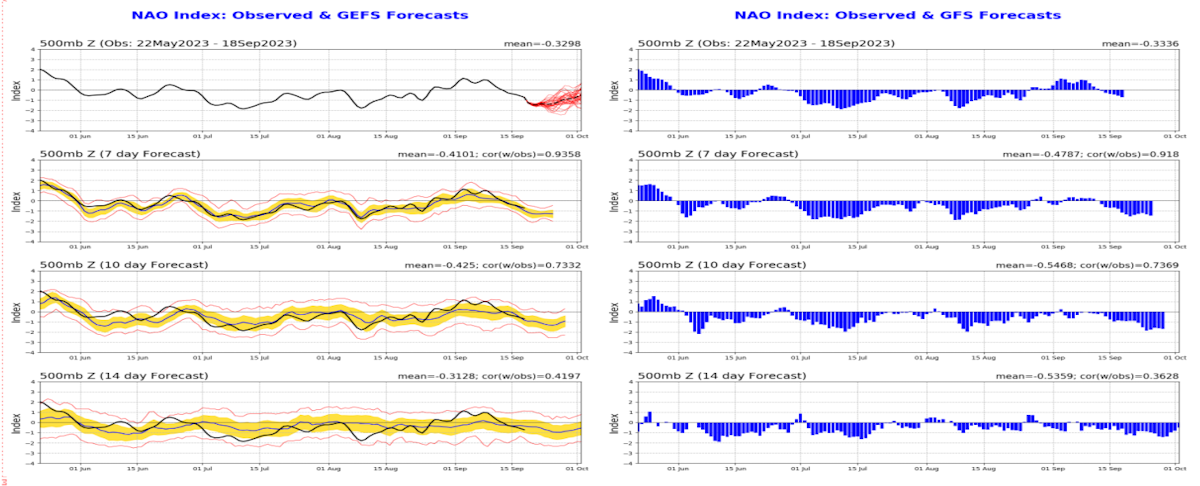
The North Atlantic Oscillation index (500hPa index shown below)is in a neutral state. A positive NAO reflects a more mobile westerly type but neutral conditions are inconclusive.

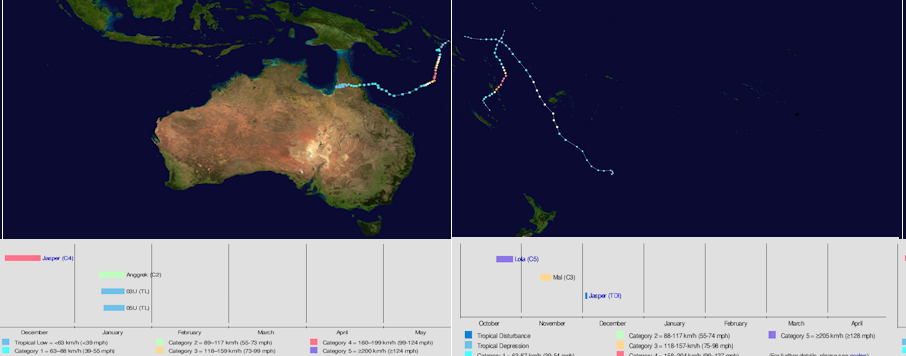
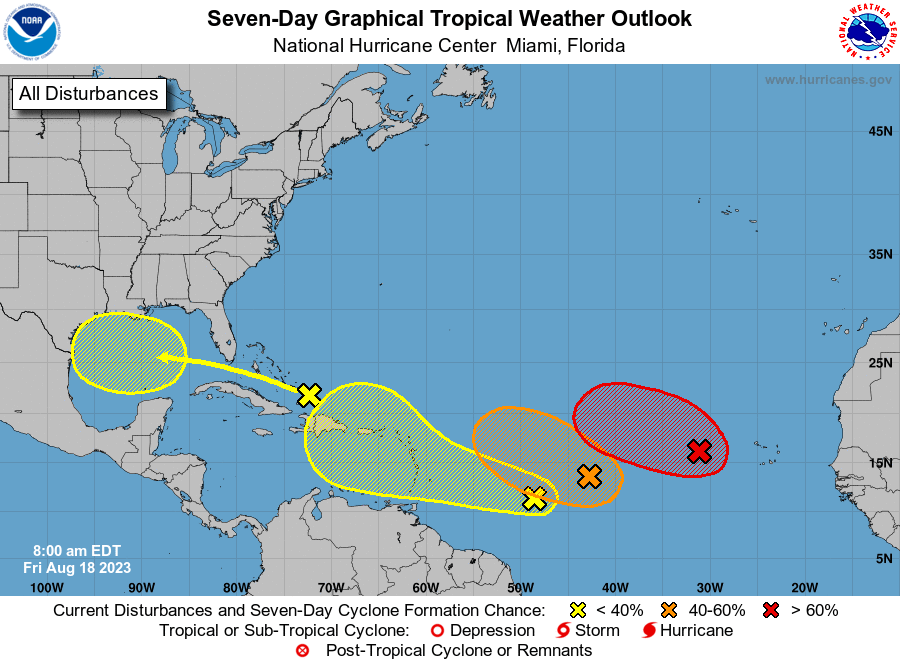
2. Tropical storms etc: (Data from Wikipedia)
Southern Indian Ocean 2023-2024. Tropical cyclones 4, intense cyclones 2. Fatalities 46.

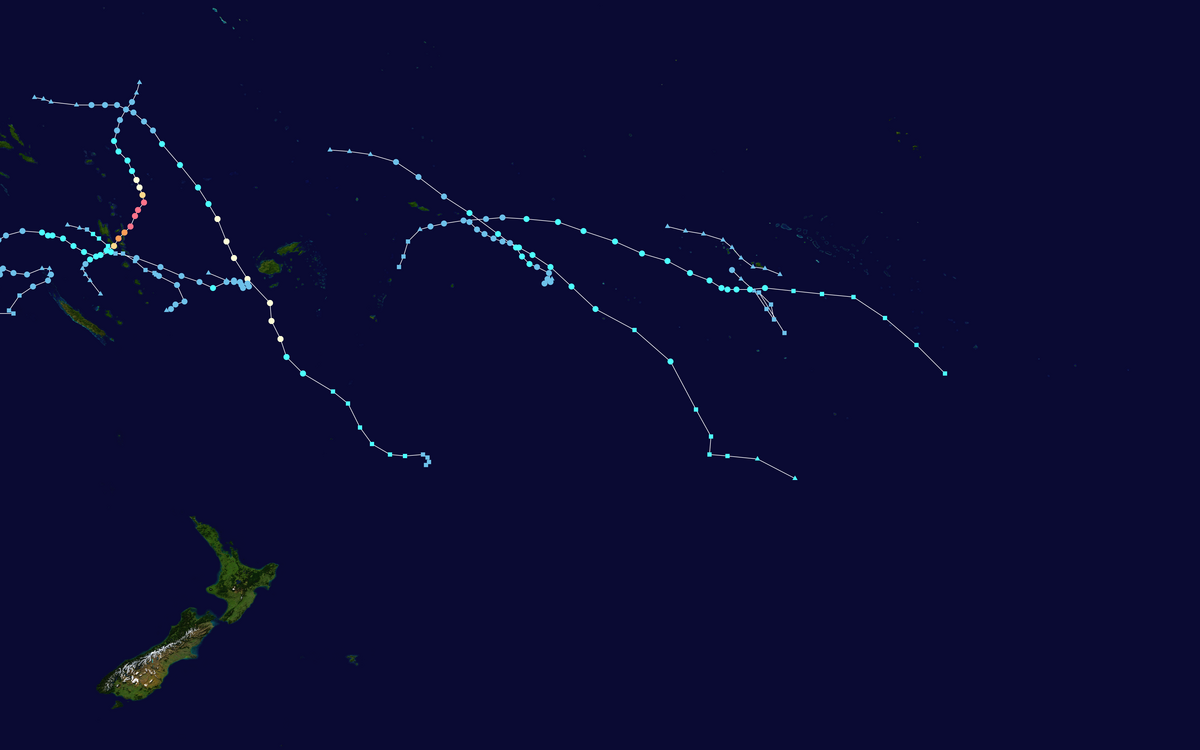
South Pacific Ocean 2023-2024. Tropical cyclones 4, severe cyclones 2. Fatalities 2
Australia region 2023-2024. Tropical cyclones 8, severe cyclones 6. Fatalities 1. Damage 675million USD.

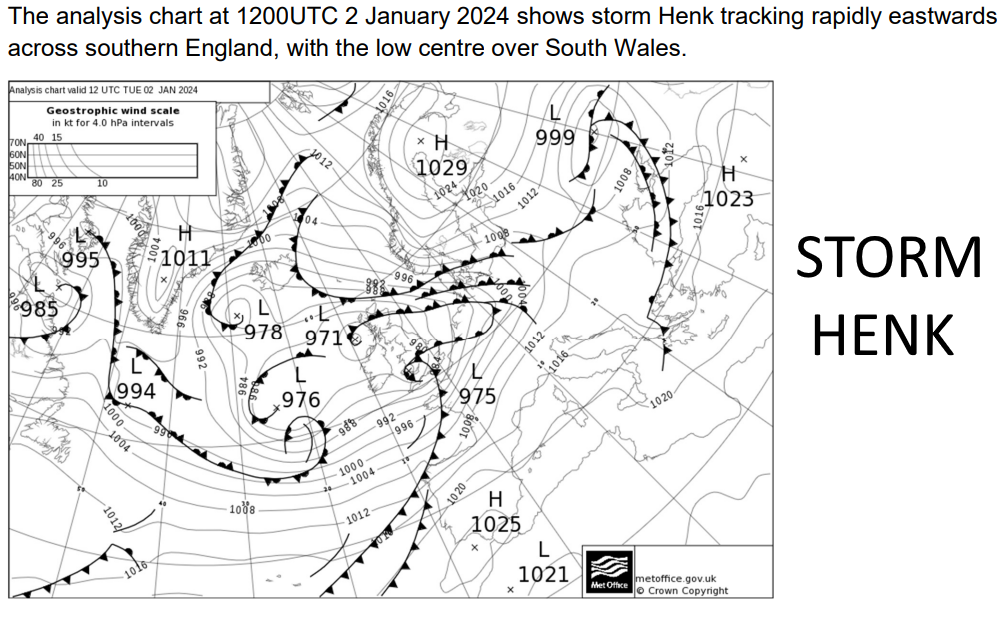
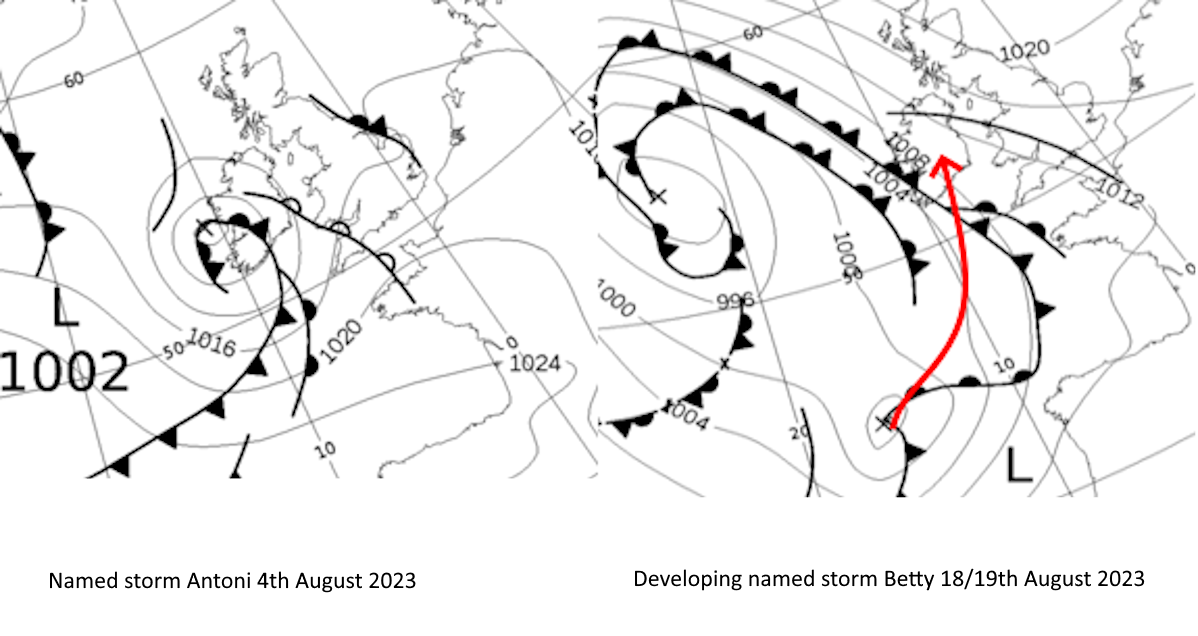
Named storms UK and Eire:

Storm Kathleen, named by the Irish Met Service 4 to 7th April. Details on the WIKI page: https://en.wikipedia.org/wiki/2023%E2%80%9324_European_windstorm_season
Preliminary reports suggest the strongest wind from Kathleen are in Northern Ireland was recorded at 69mph (111 km/h) at Orlock Head in County Down. However, in Scotland, an unofficial windspeed of 101mph (162km/h) was recorded at Cairn Gorm. This is awaiting verification from the Met Office.
See also Storm Nelson was named on 26 March 2024 by Spain‘s AEMET, Storm Pierrick named by Meteo France on 8 April 2024 and Storm Renata named by Meteo France on 14 April 2024. All had some impact on parts of the UK.
3. Recent Climatology
SW England: The mean temperature has been about one degree above the thirty year average up to 22nd April. Rainfall has almost reached the April average in many places and possible exceeded this over the hills.
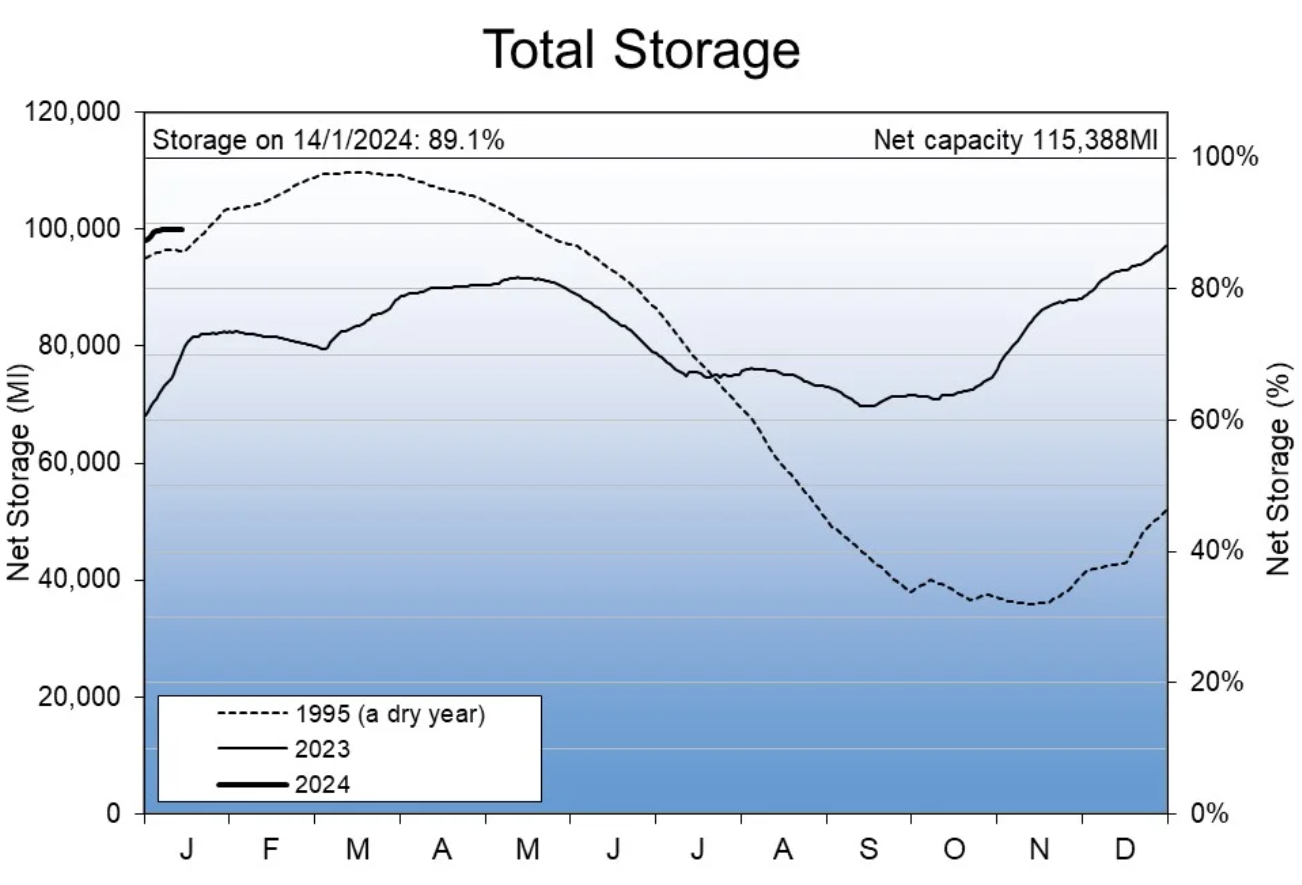
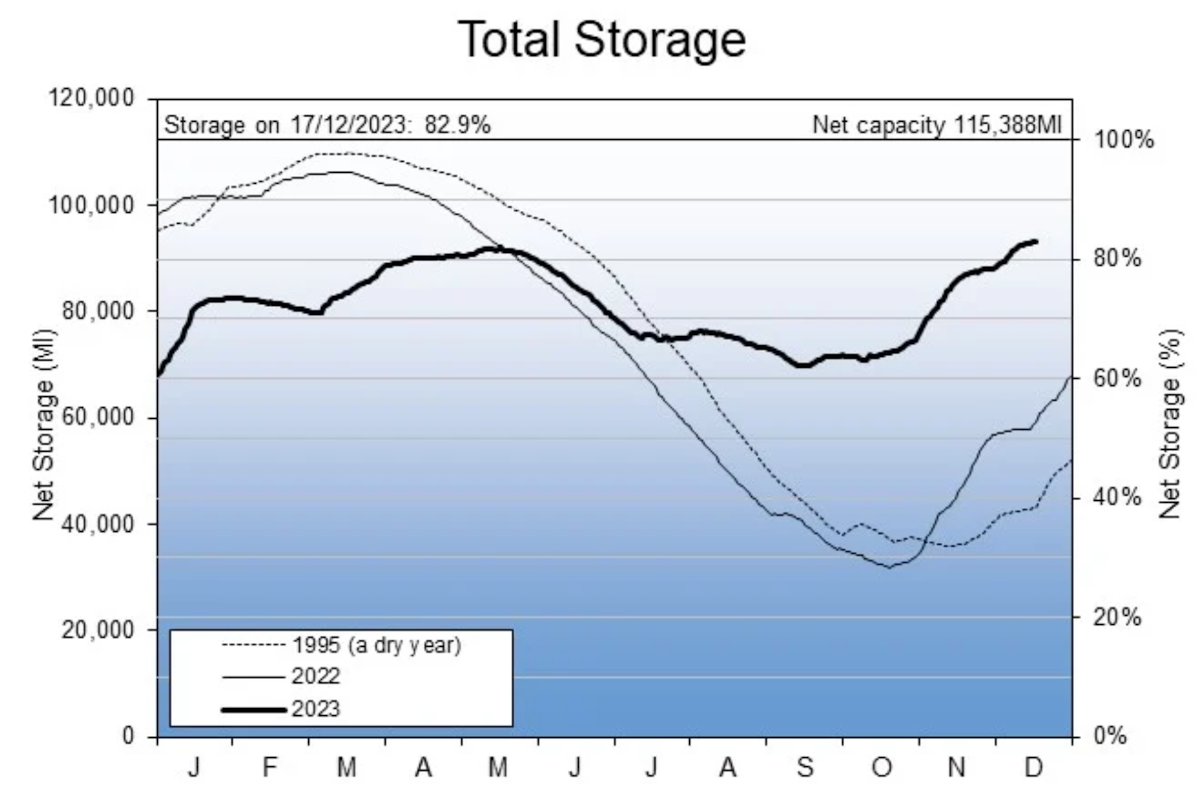
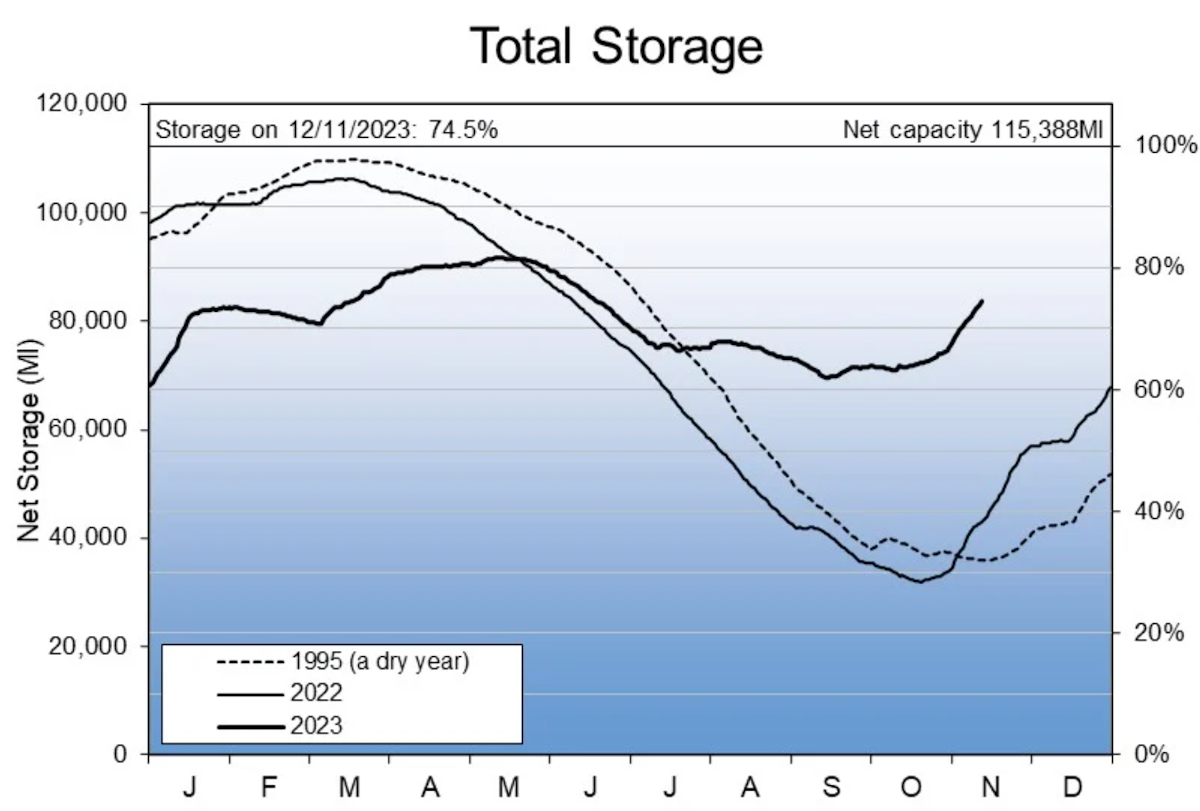
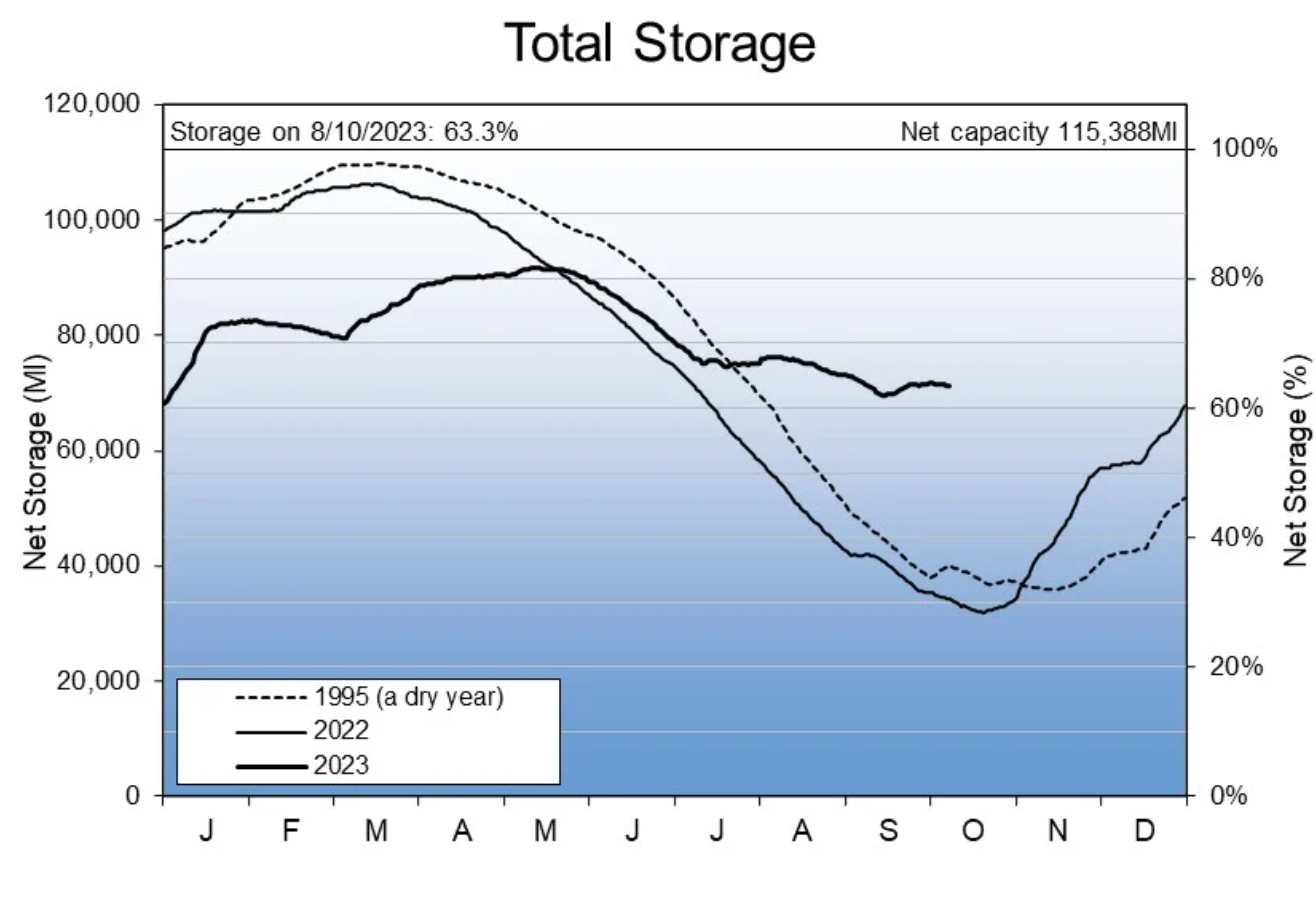
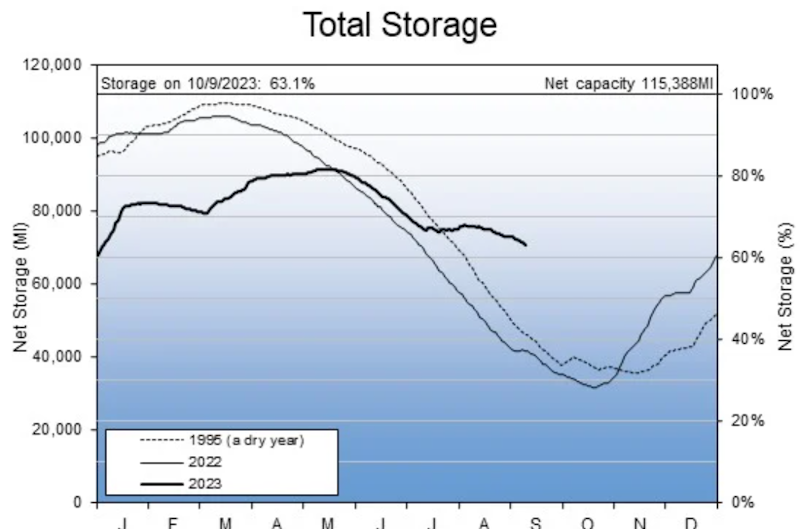
Reservoir levels, according to SW Water, are above the long term average across SW England as of 14th April 2024.

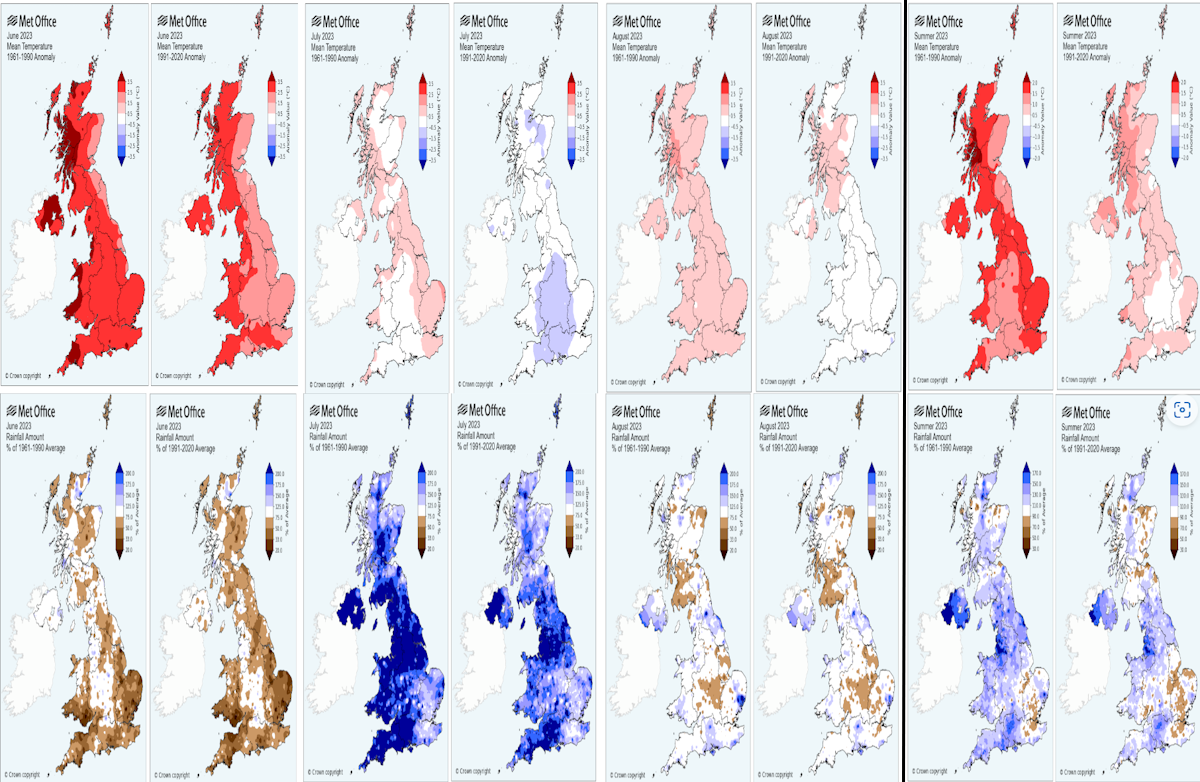
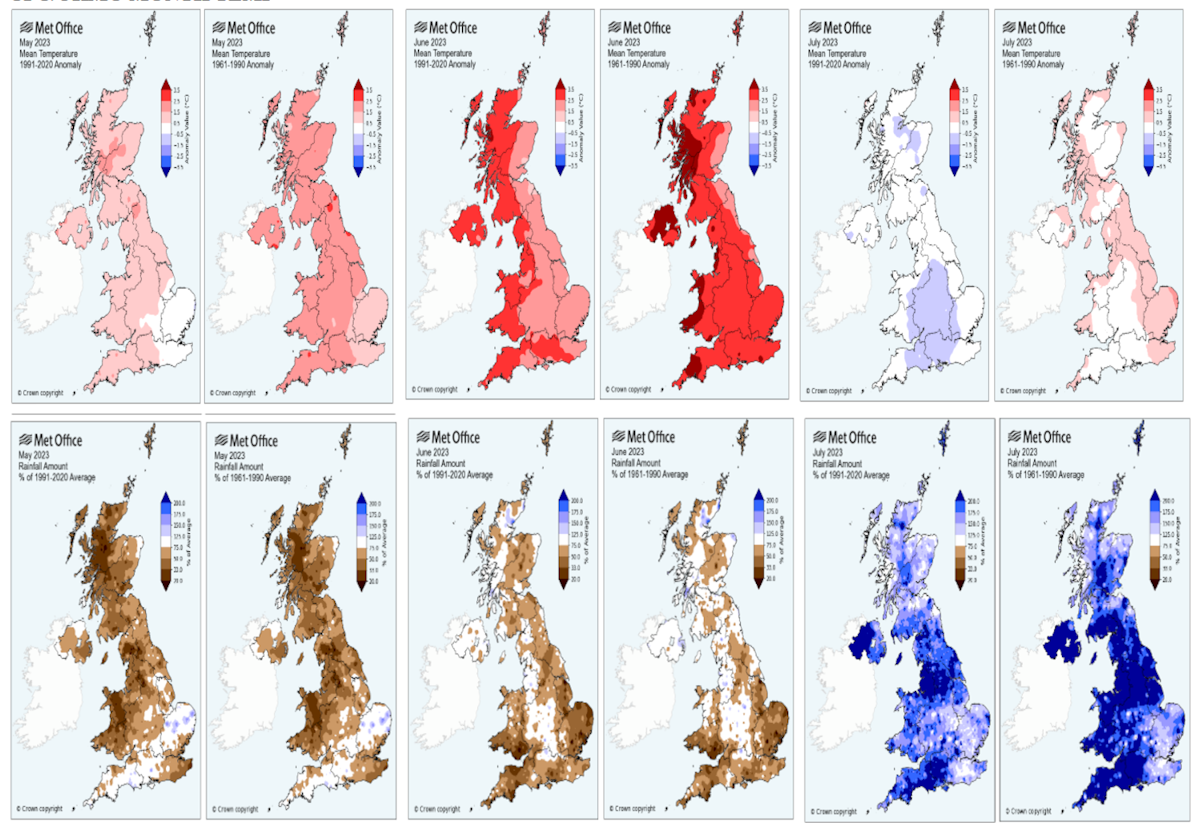
Met Office provisional Temperature and Rainfall anomalies for January, February and March 2024 are shown below. You can see the effect of an increase in average temperatures in the 1991 to 2020 period (right hand mini pictures) when comparing the images for the earlier 30 year averaging period. Temperatures in most areas were above average for the three month period thanks to a much milder December when compared to the recent 30 year average. Rainfall was notably above average in the S and central England UK whereas W Scotland and parts of N Ireland had near or below average precipitation.

March 2024 – 10th consecutive record warm month globally
According to climate.copernicus.eu March 2024 is the tenth month in a row to be the hottest for the respective month in the ERA5 data record, going back to 1940.
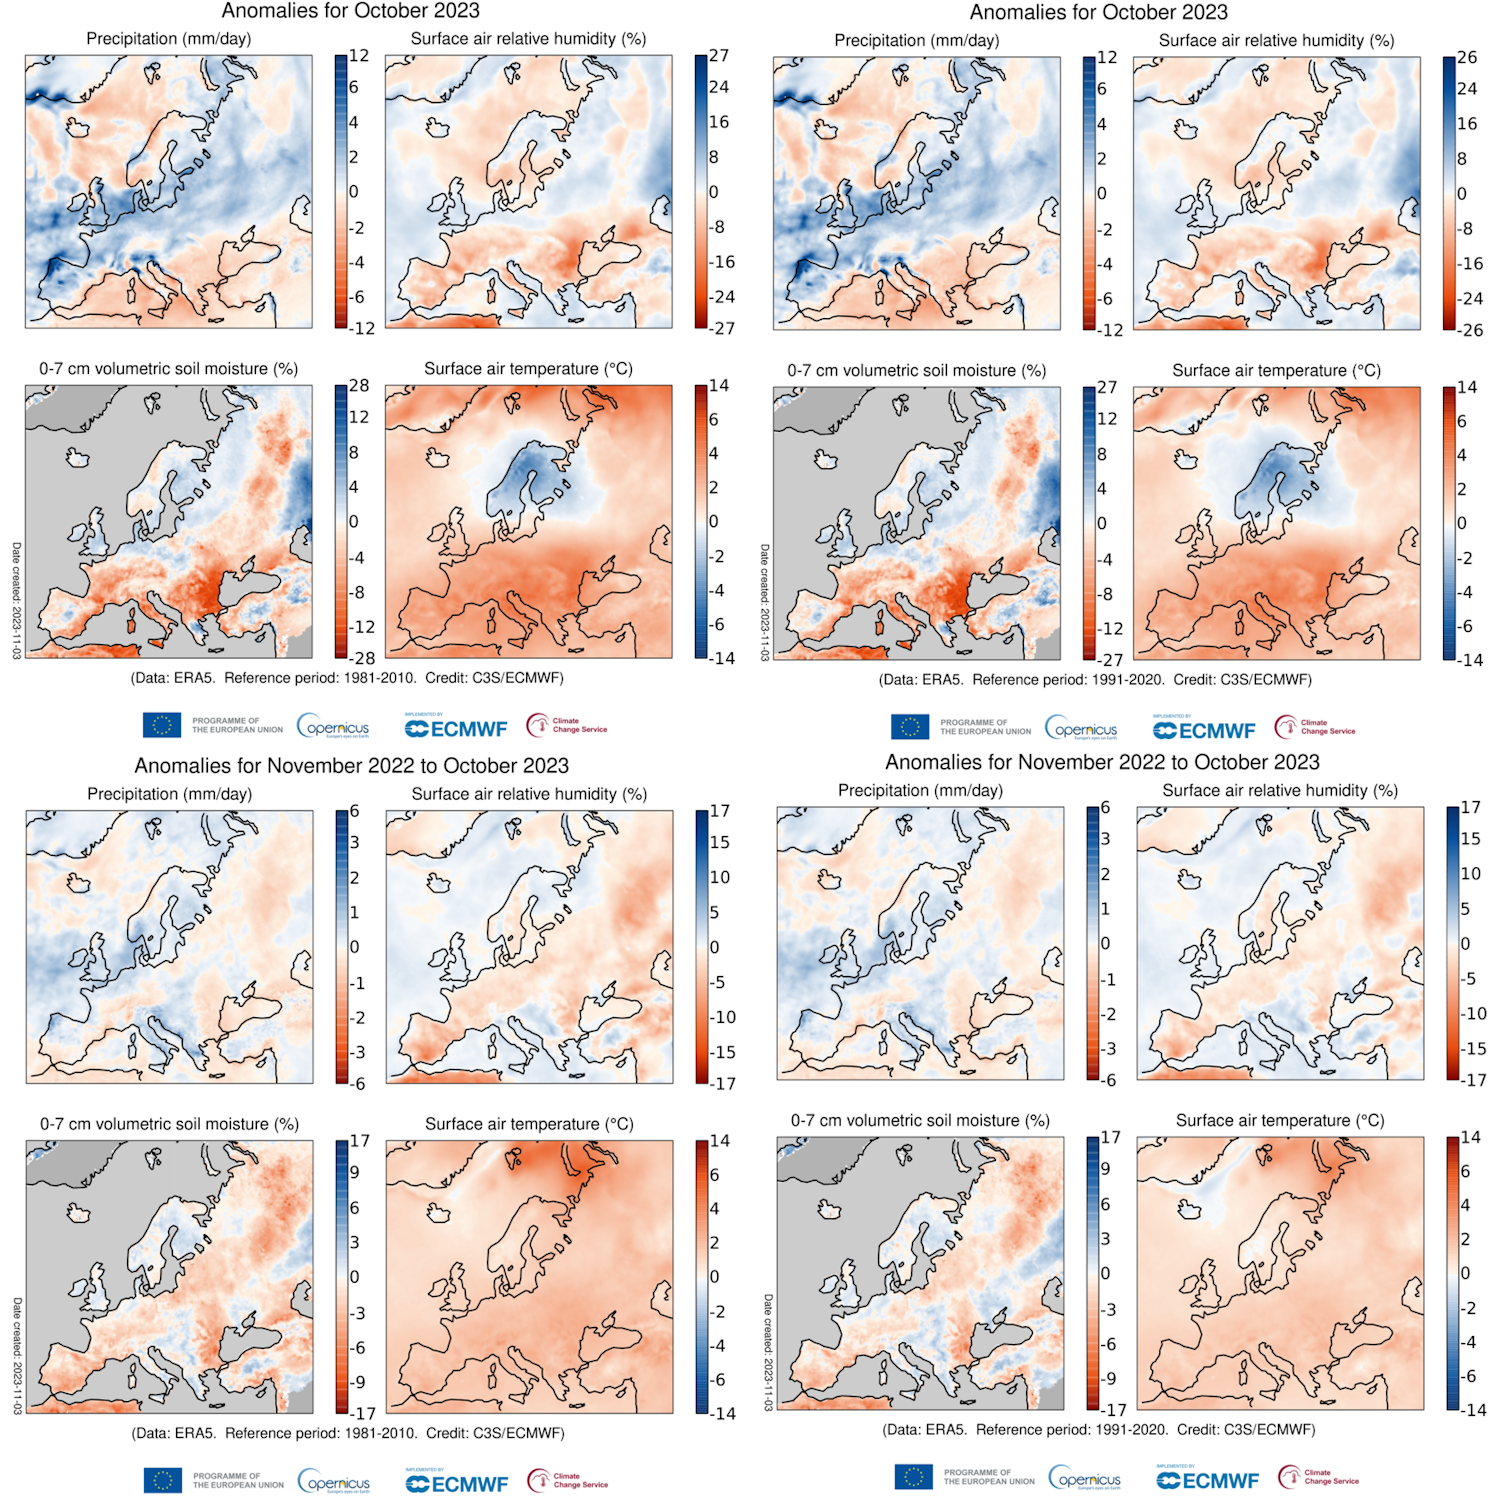
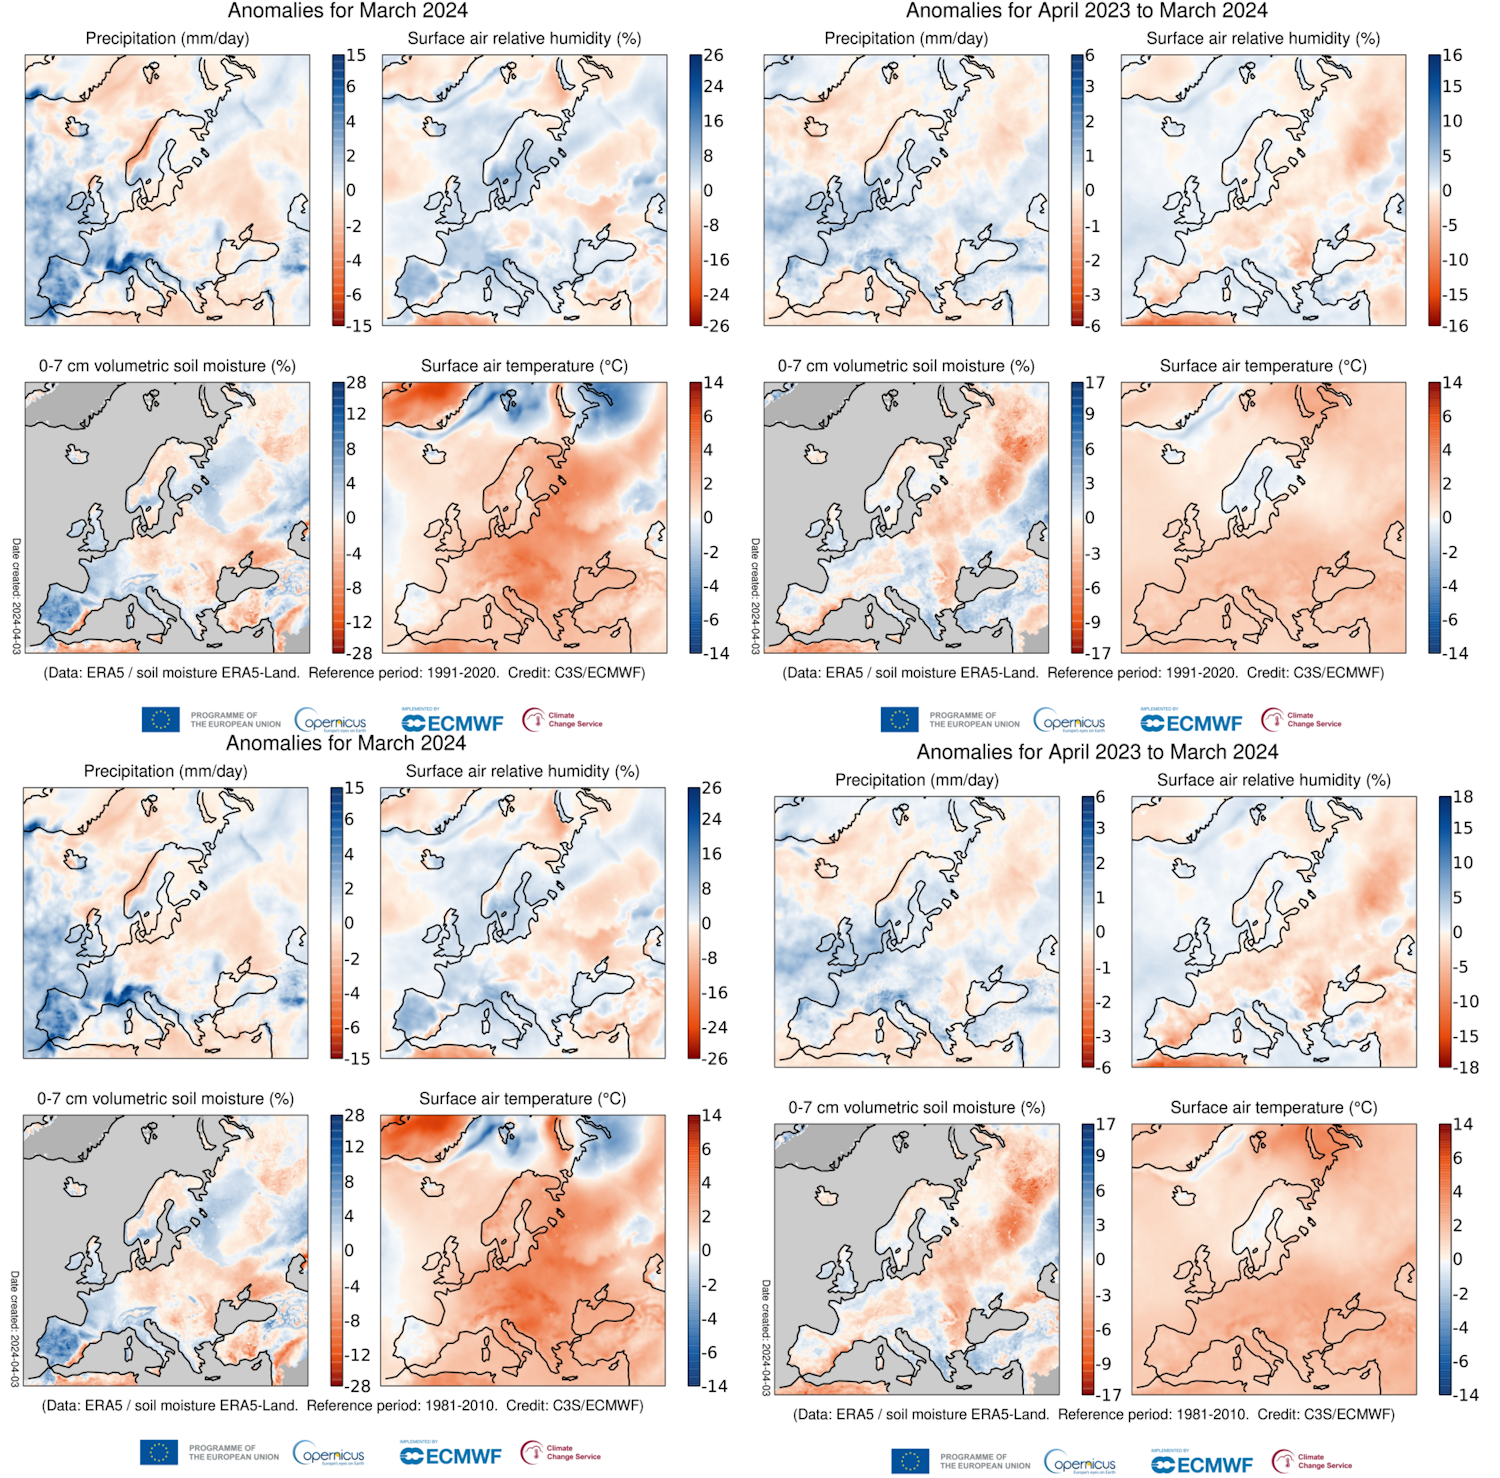
Europe Climate:
Copernicus, European sourced temperature and rainfall anomalies for March 2024 and year to date, compared with the 30 year periods 1991-2020 (top) and 1981-2010 (lower) shown below:
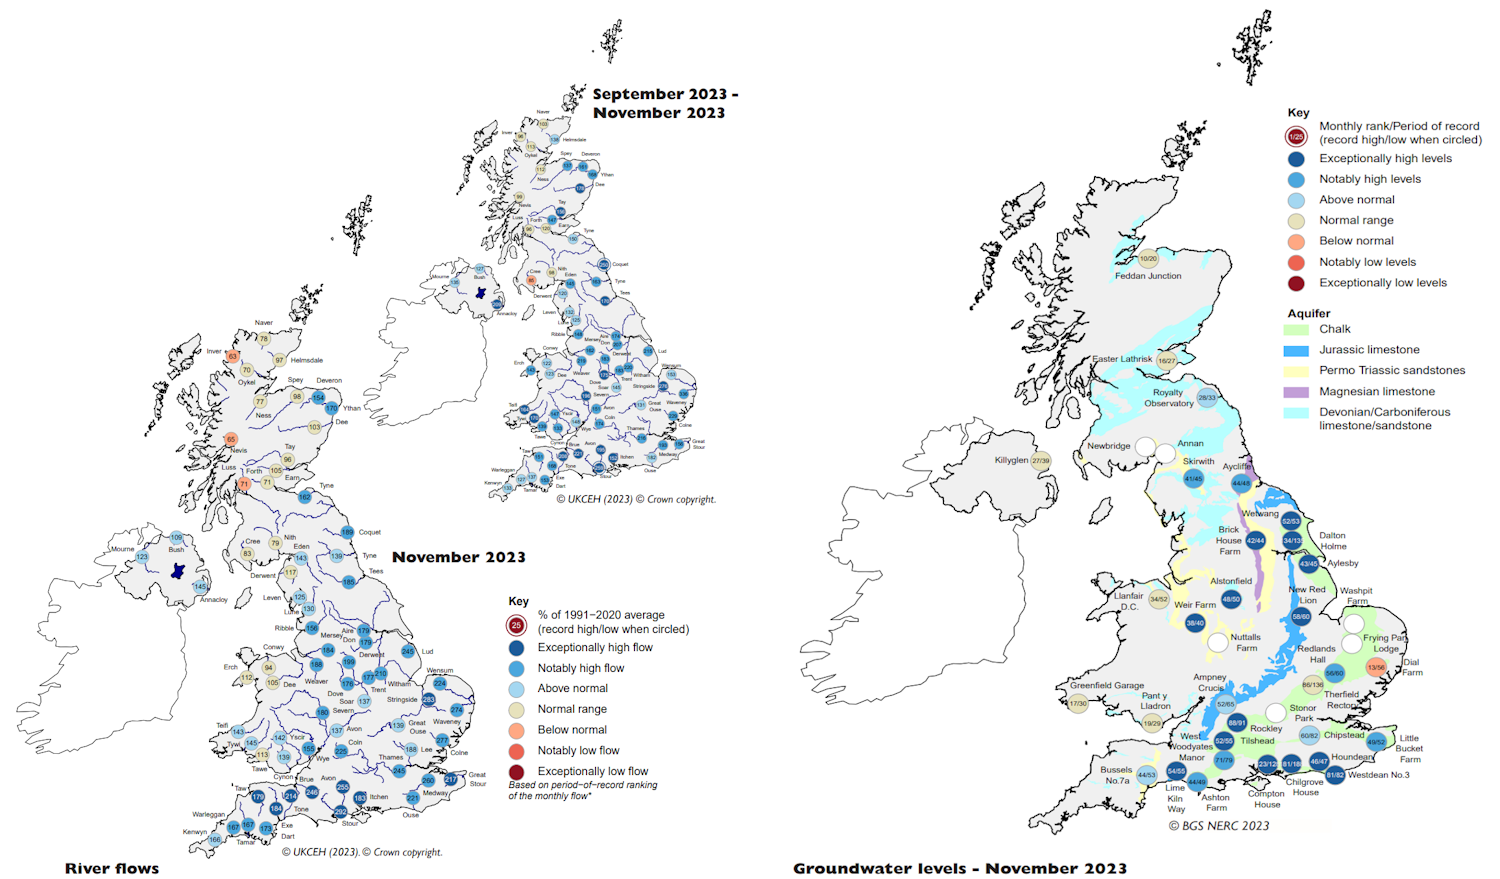
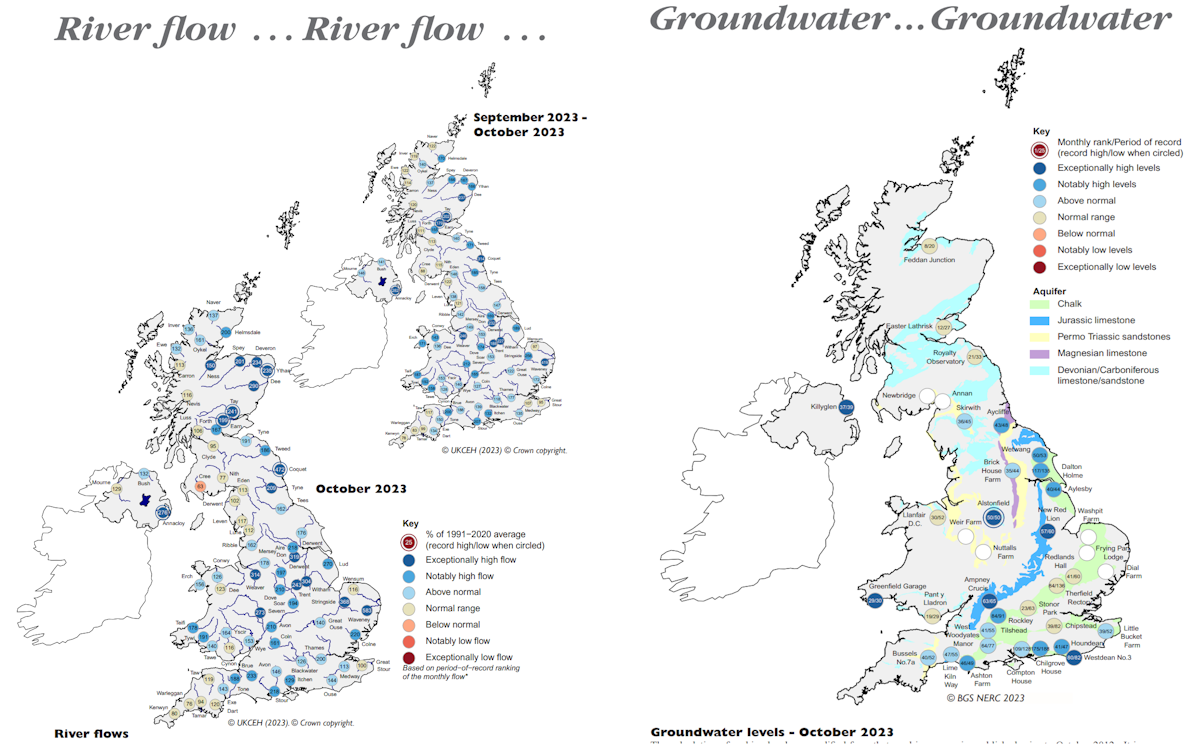
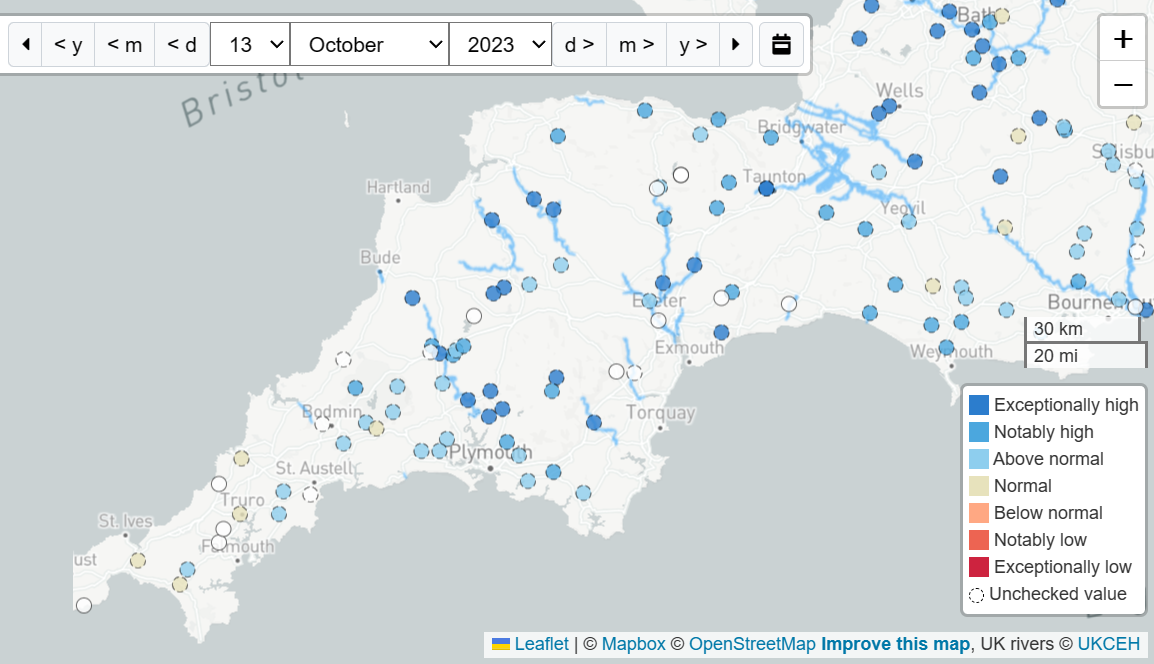
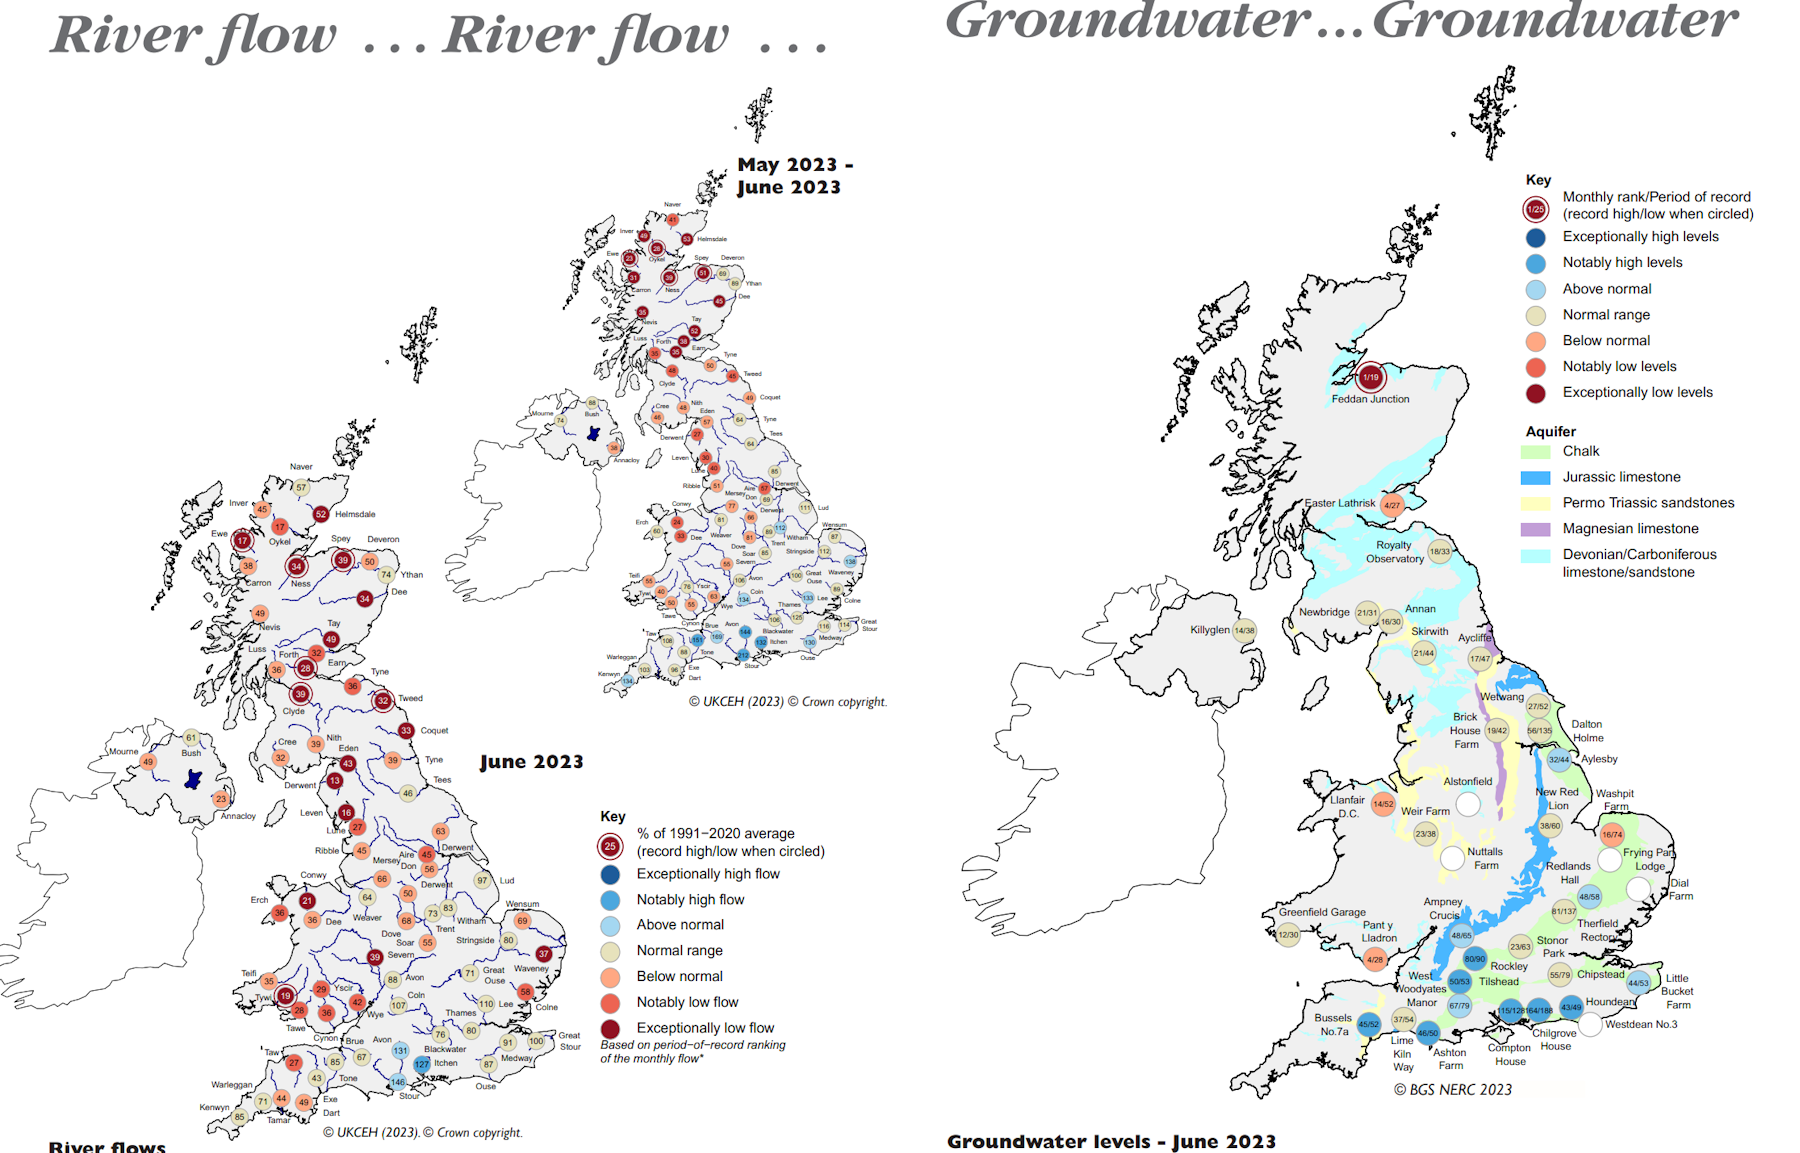
River flows and ground water levels in March 2024 can be found in the Hydrological Summary

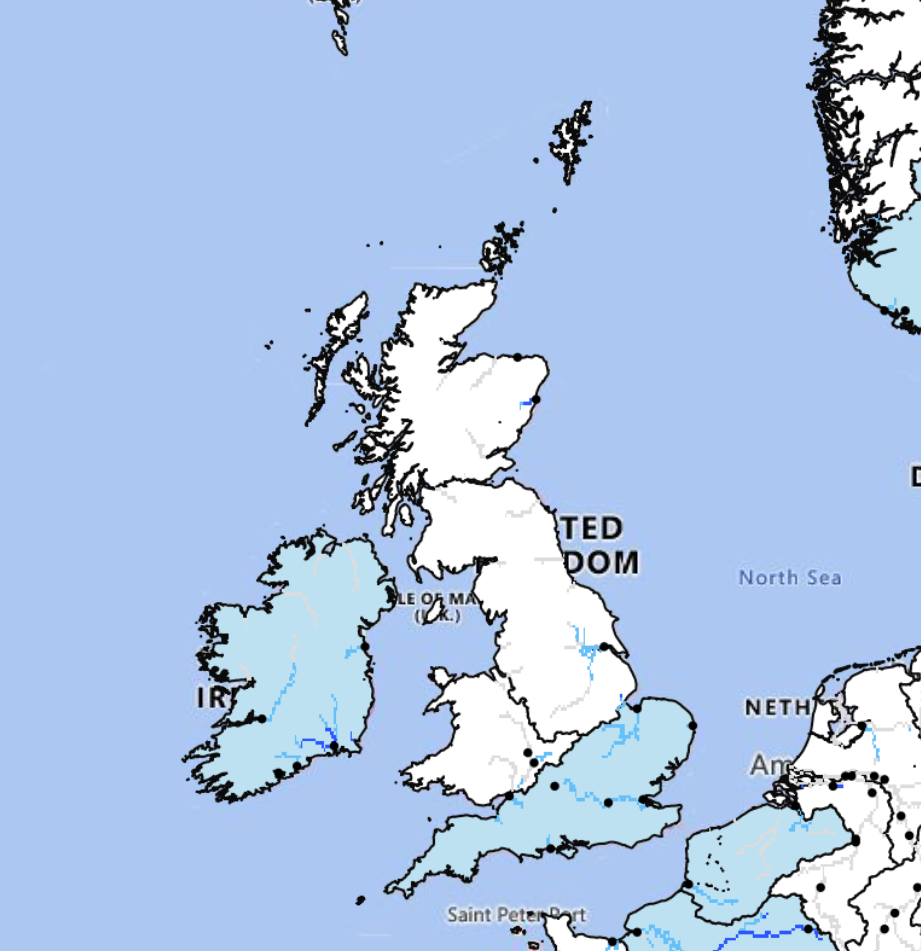
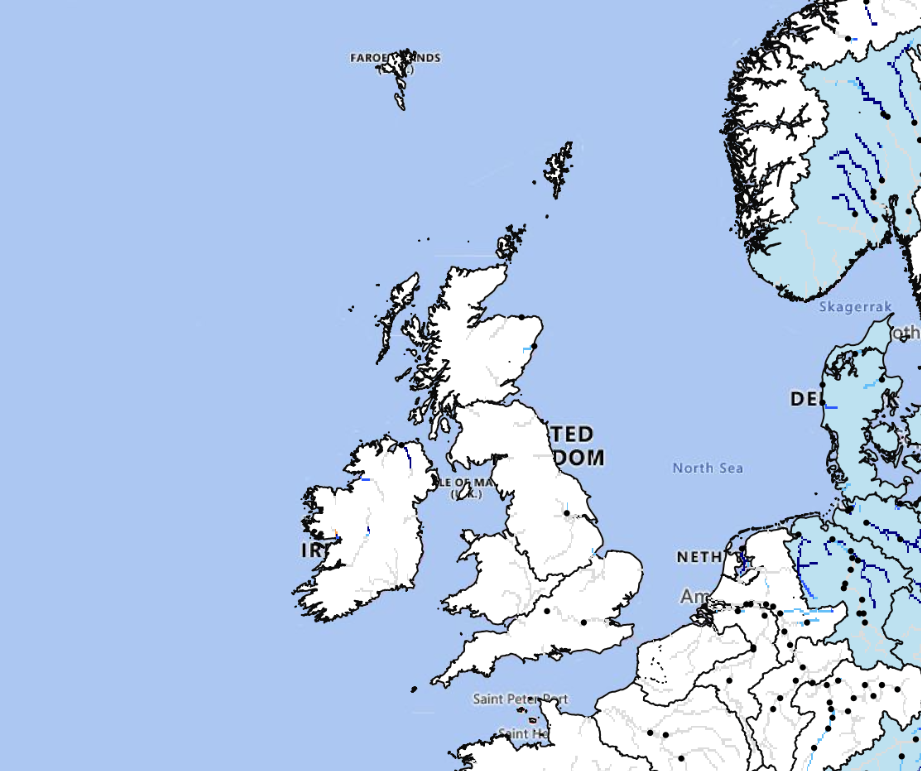
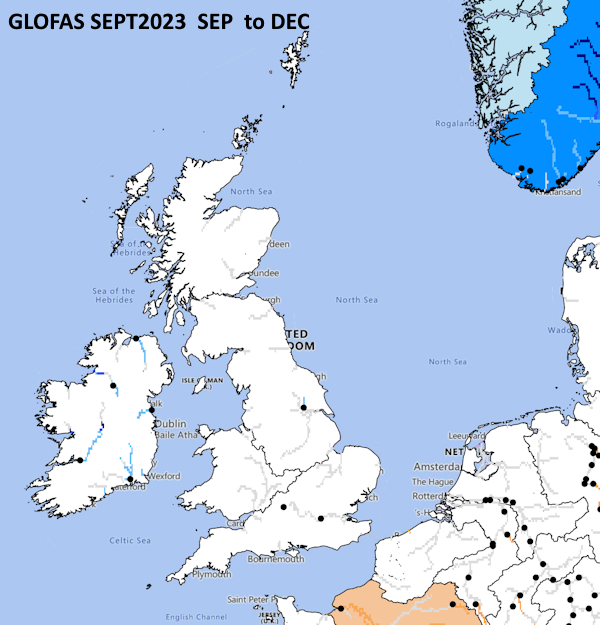
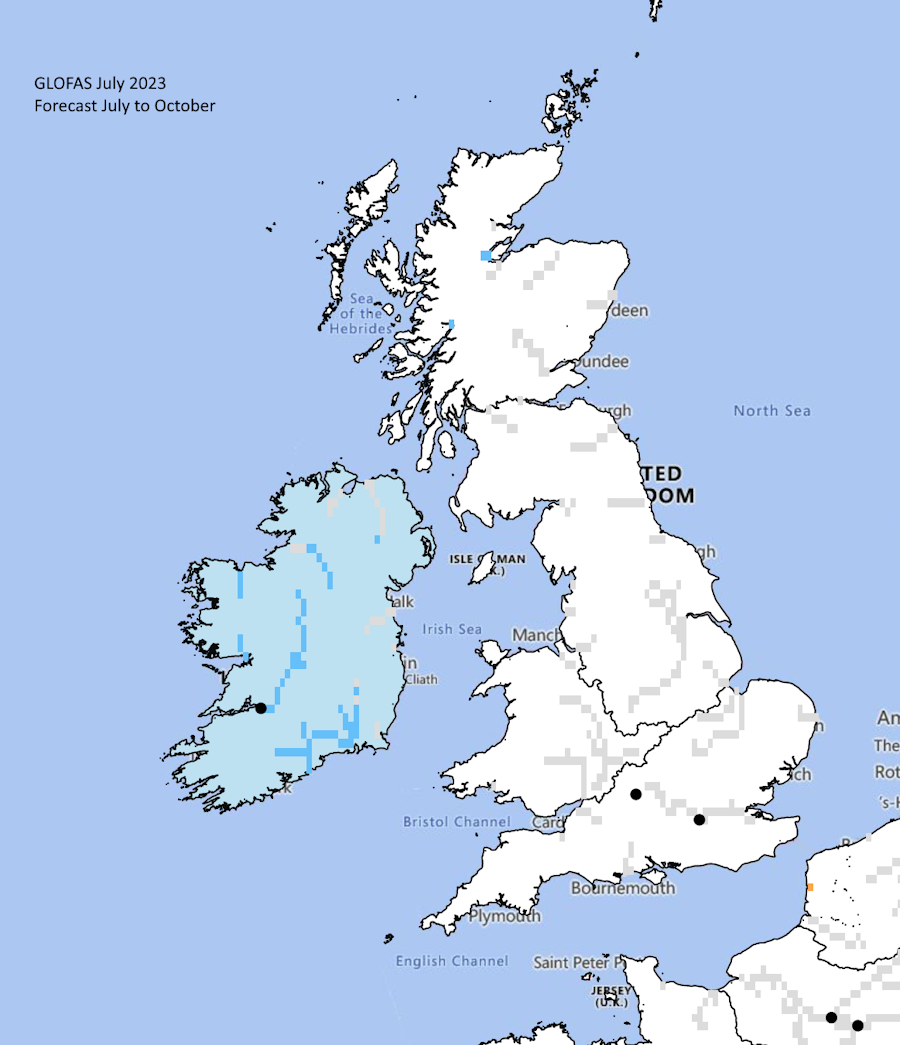
The Global Flood Awareness System – GloFAS – forecast from April 1st 2024 to end of July 2024. The map shows enhanced flood risk across the UK and Eire. Flash flooding, from for example thunderstorms, is not covered by this system.

B: Forecast data:
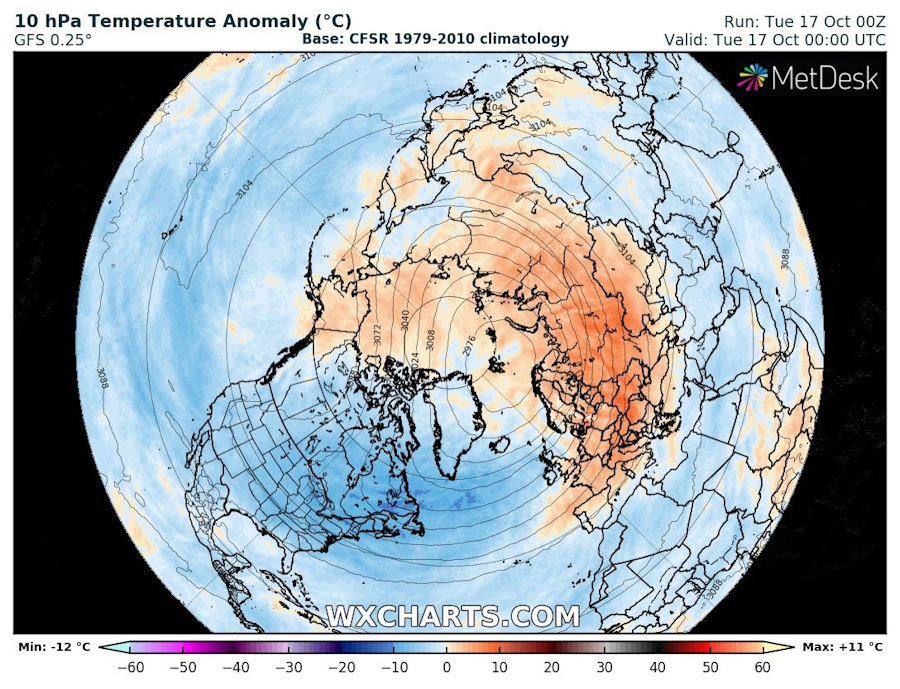
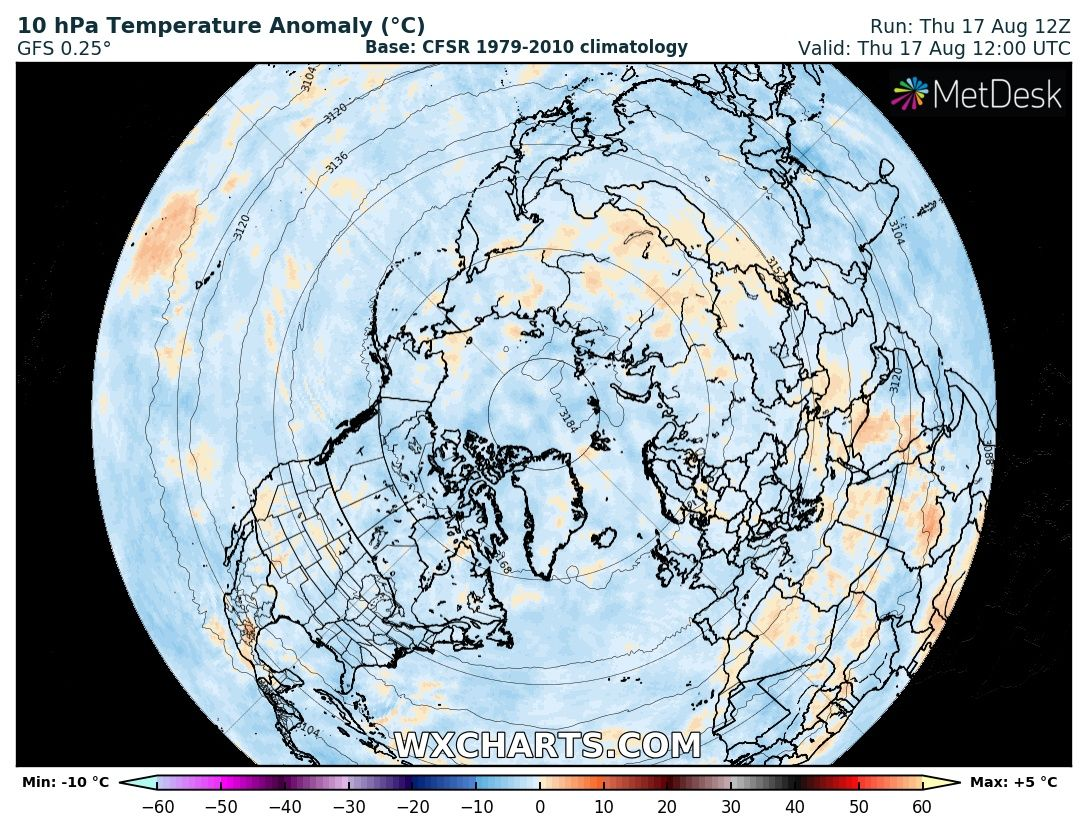
1. Stratosphere:
The North Polar Stratospheric Vortex completely warmed out early in March and has transitioned to its “summer” state earlier than average. Plot above shows 10hPa temperature anomaly and contour for 23rd April 0600UTC.

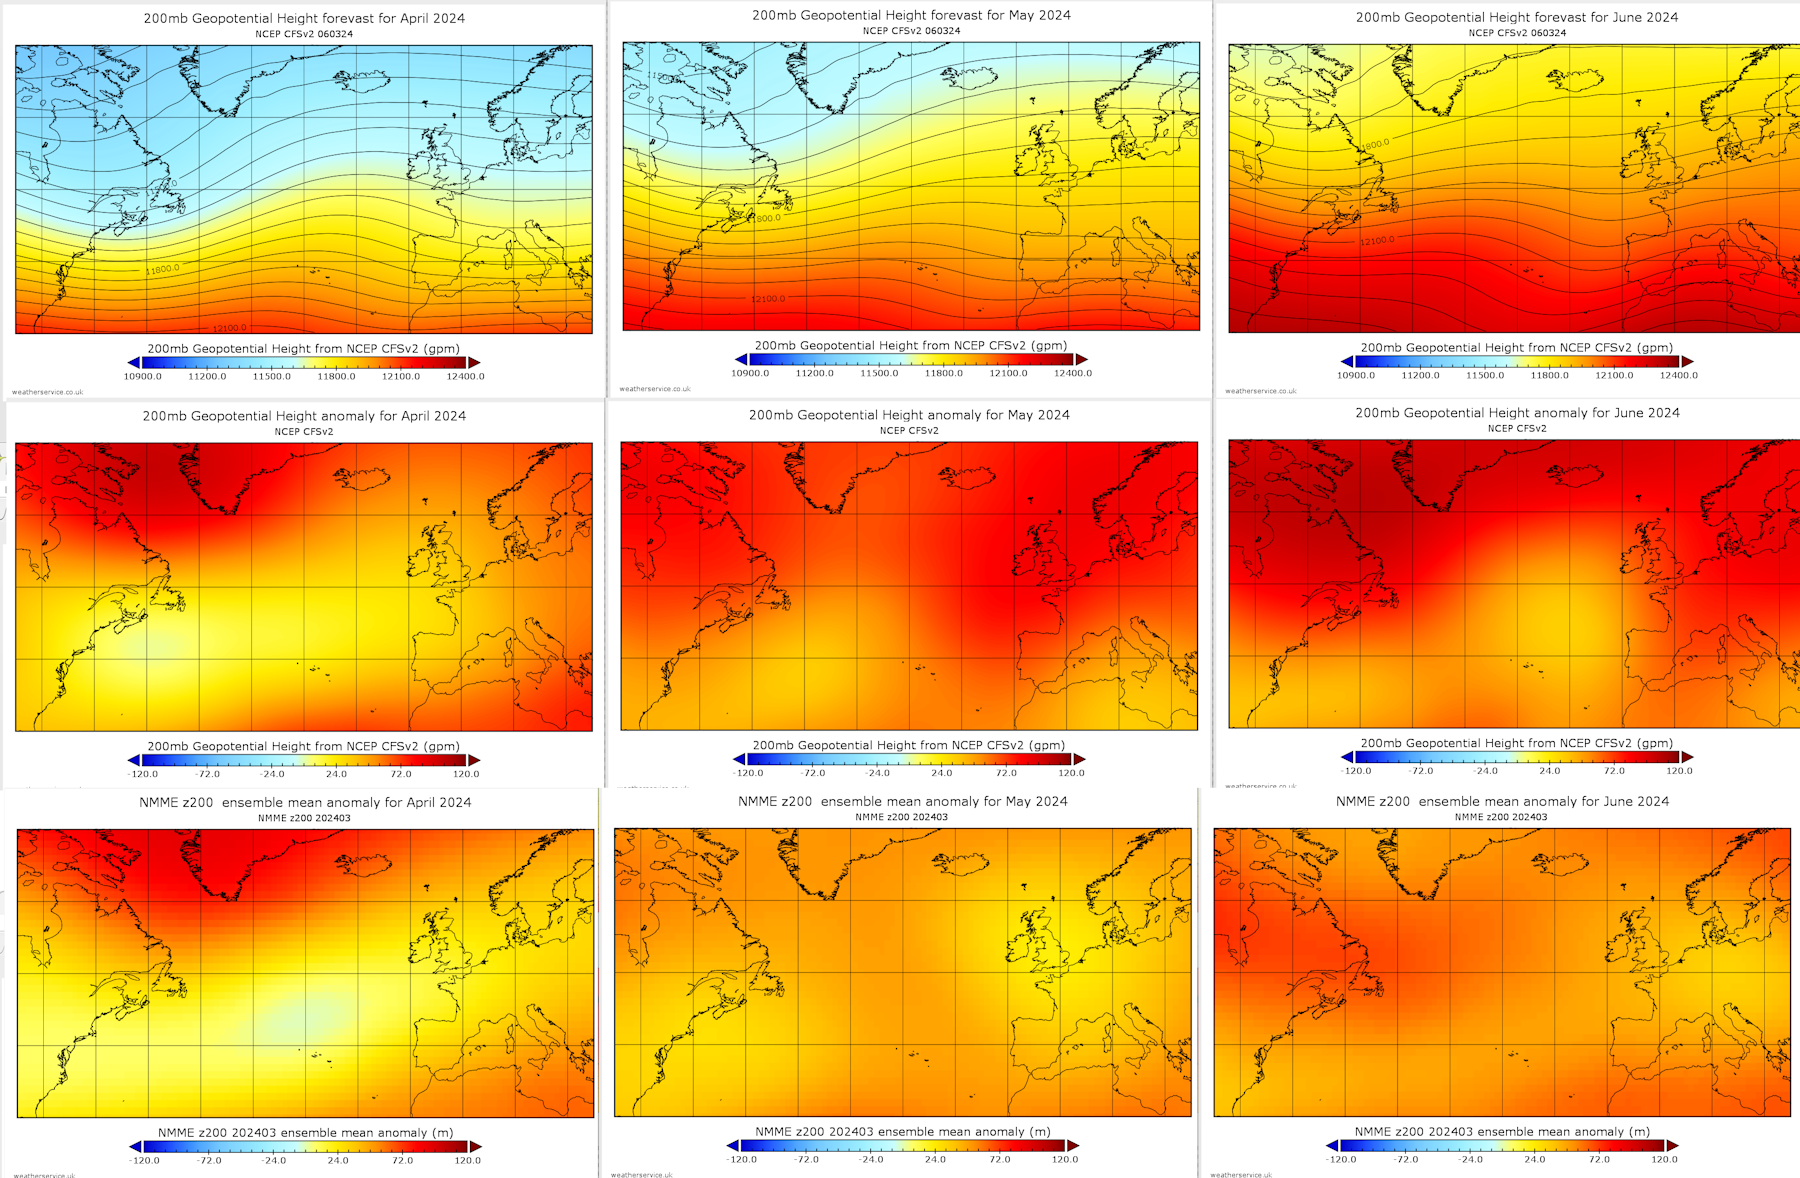
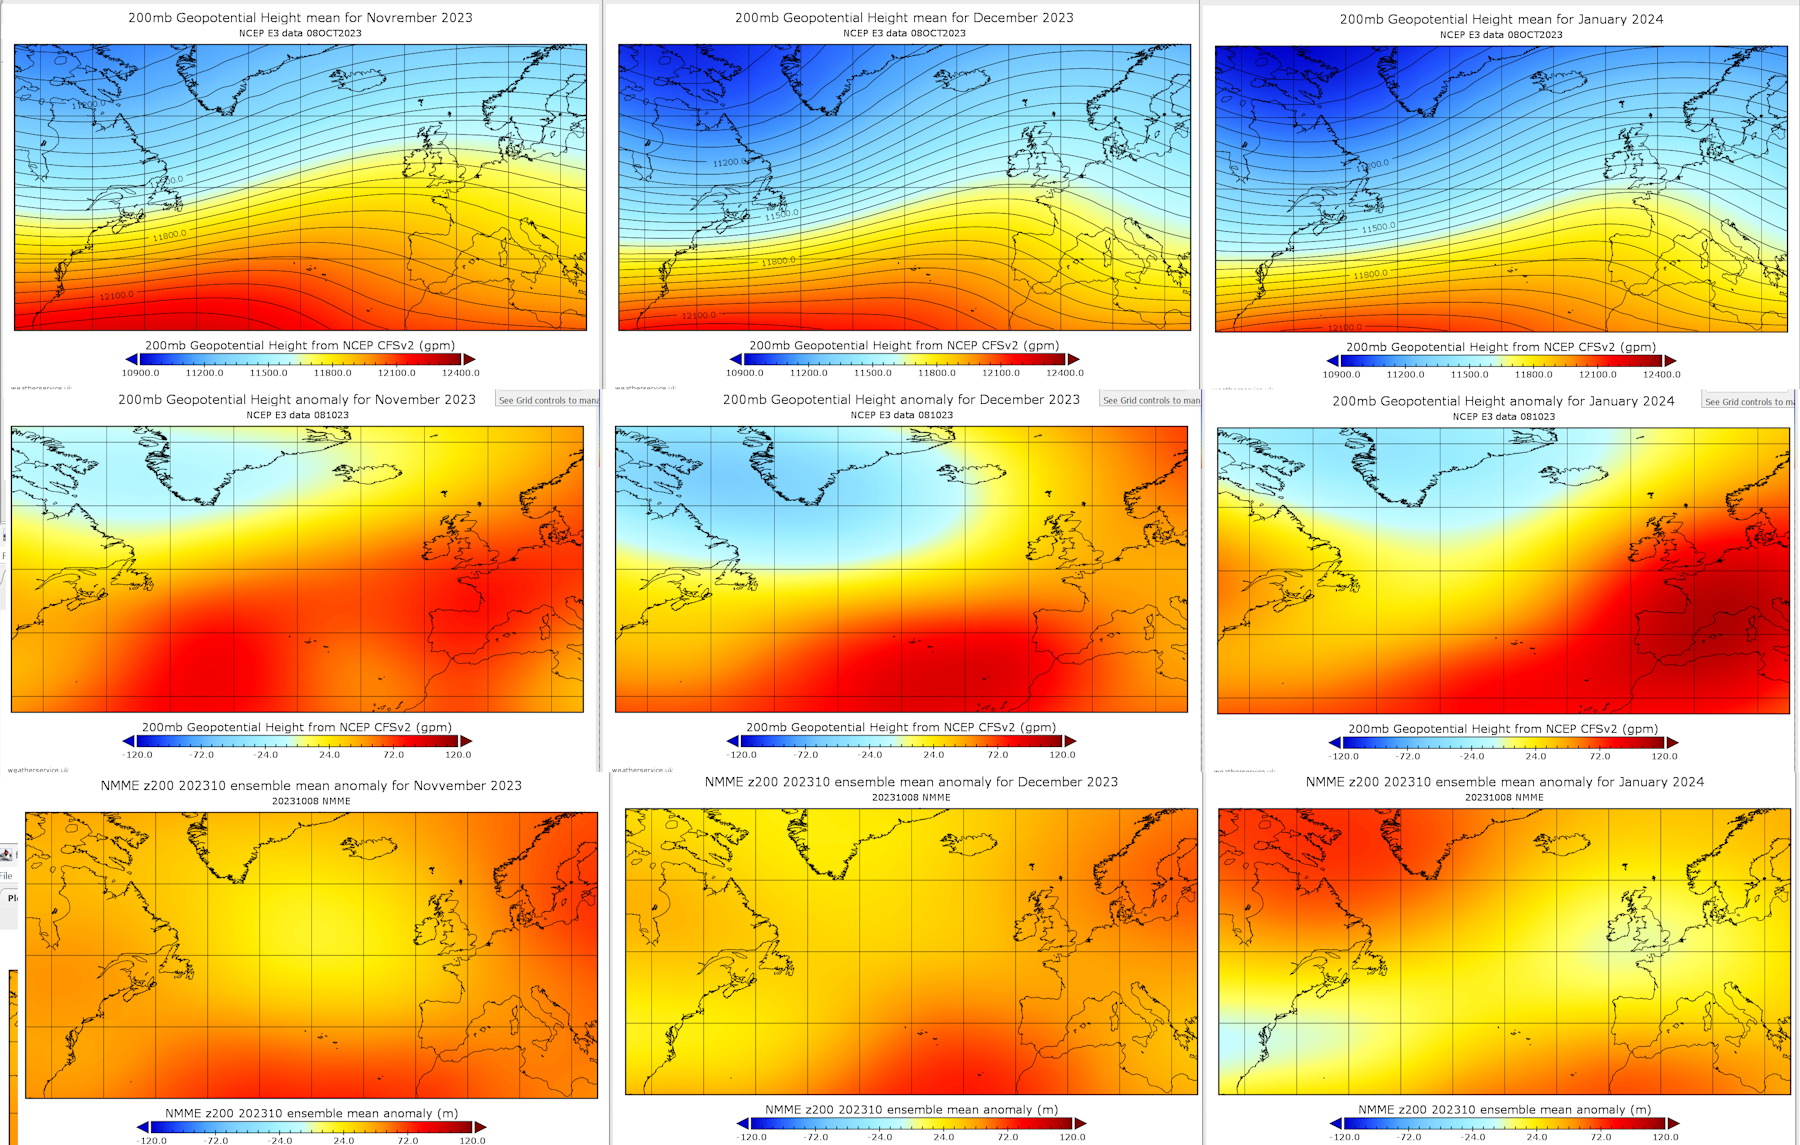
2. Upper troposphere:
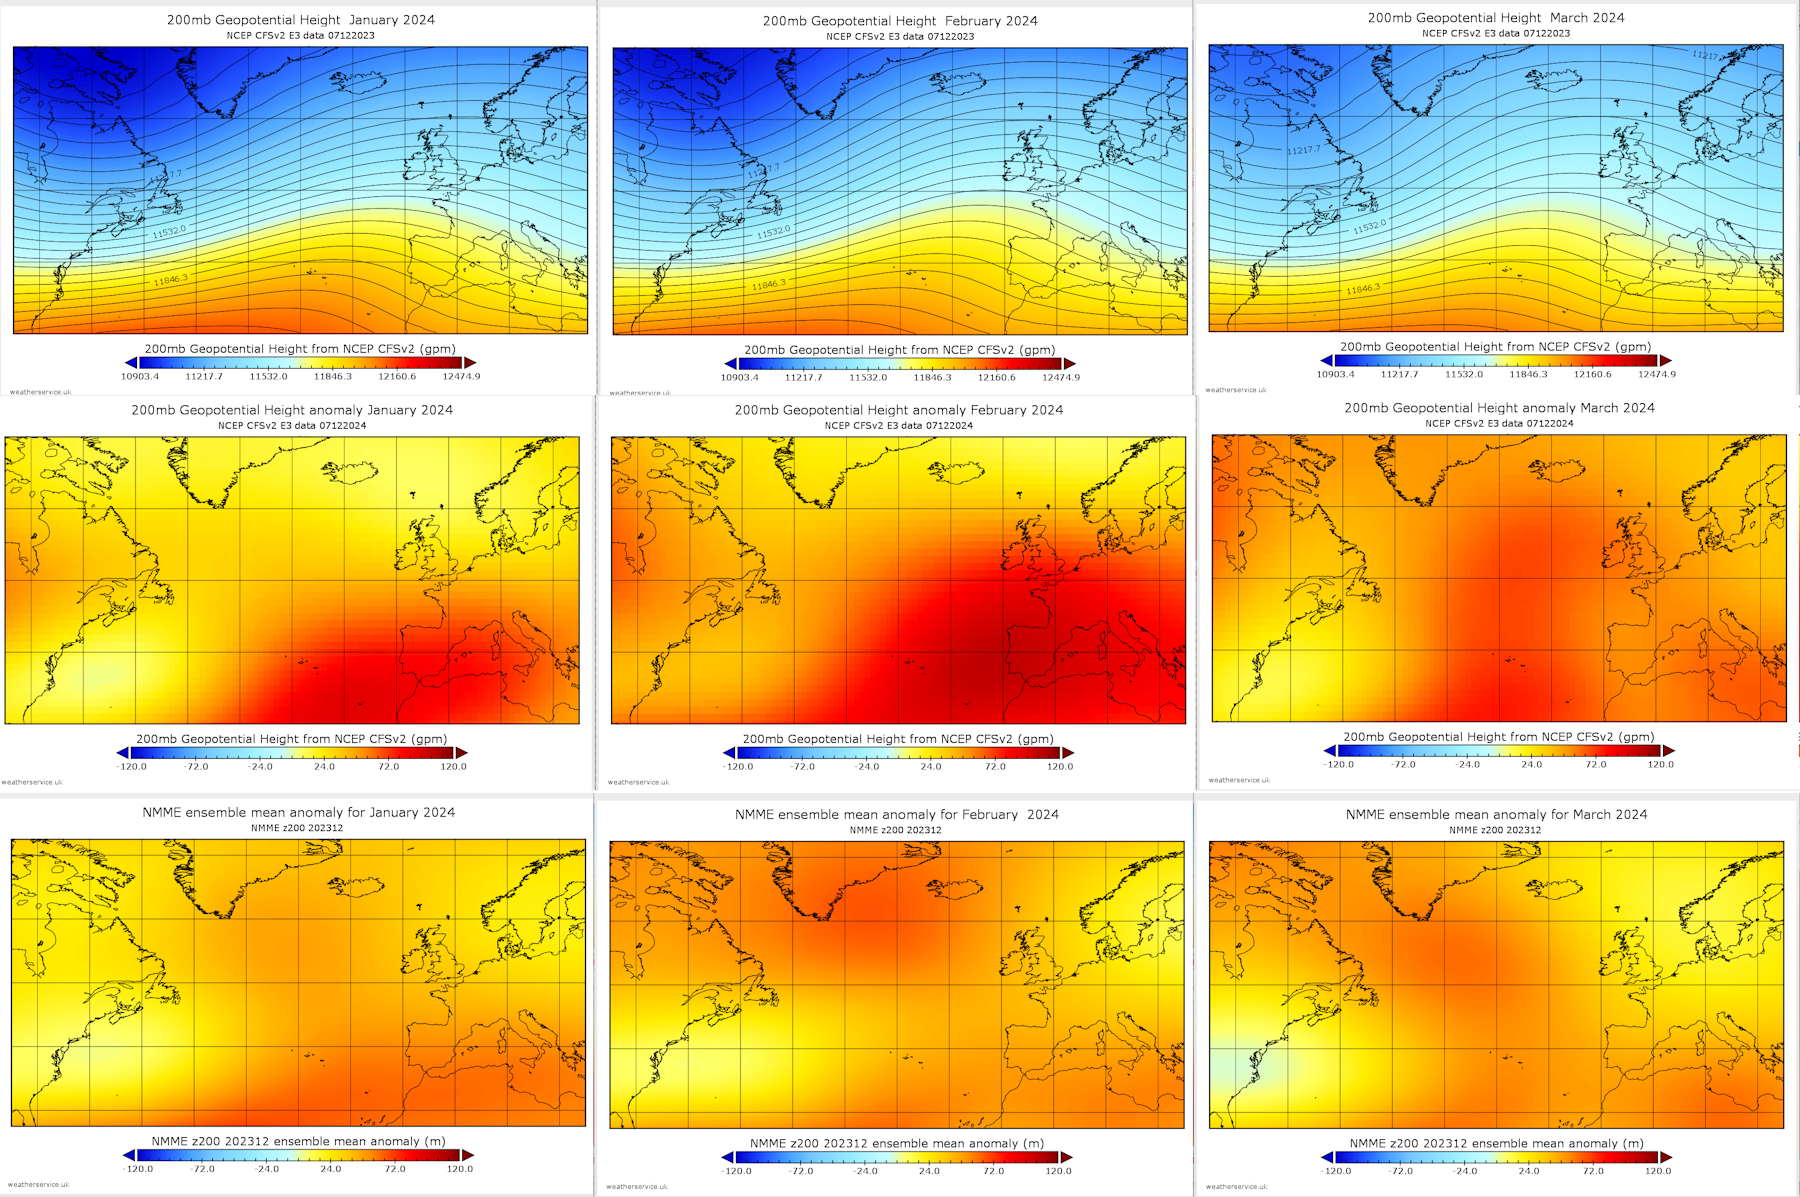
CFSv2 200hPa contours (top row) and CFSv2 anomaly (middle row) and NMME anomaly (lower row) for 2024 May June July. Charts suggest that Atlantic mobility is reduced with possible ridging across northern Europe.

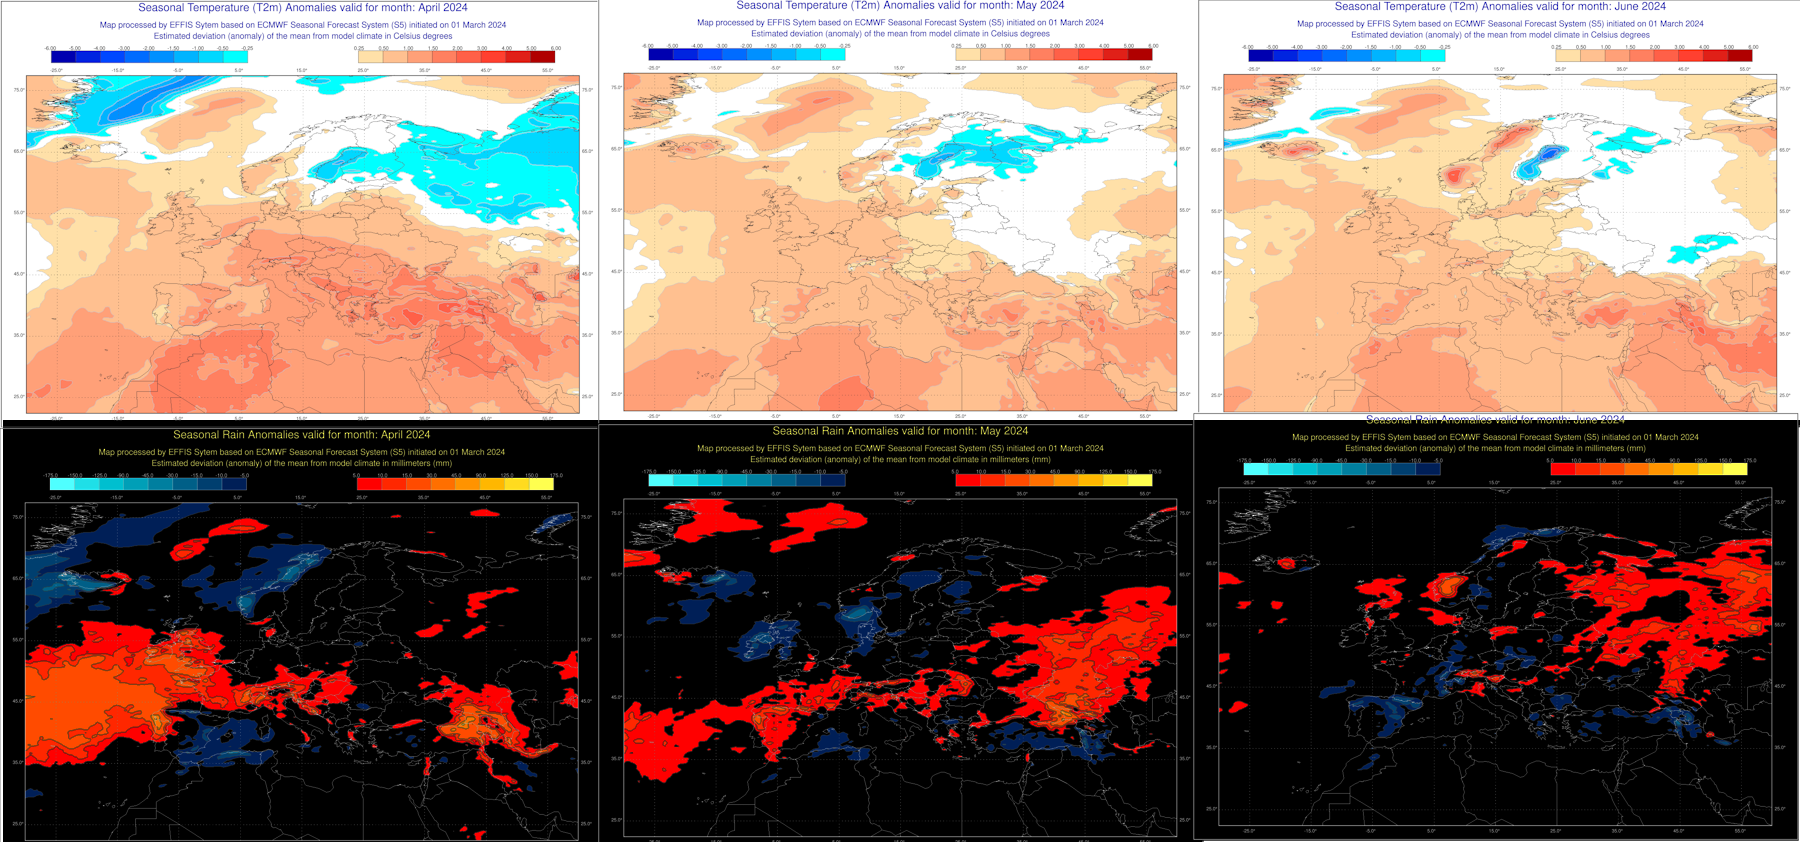
3. Lower Troposphere:
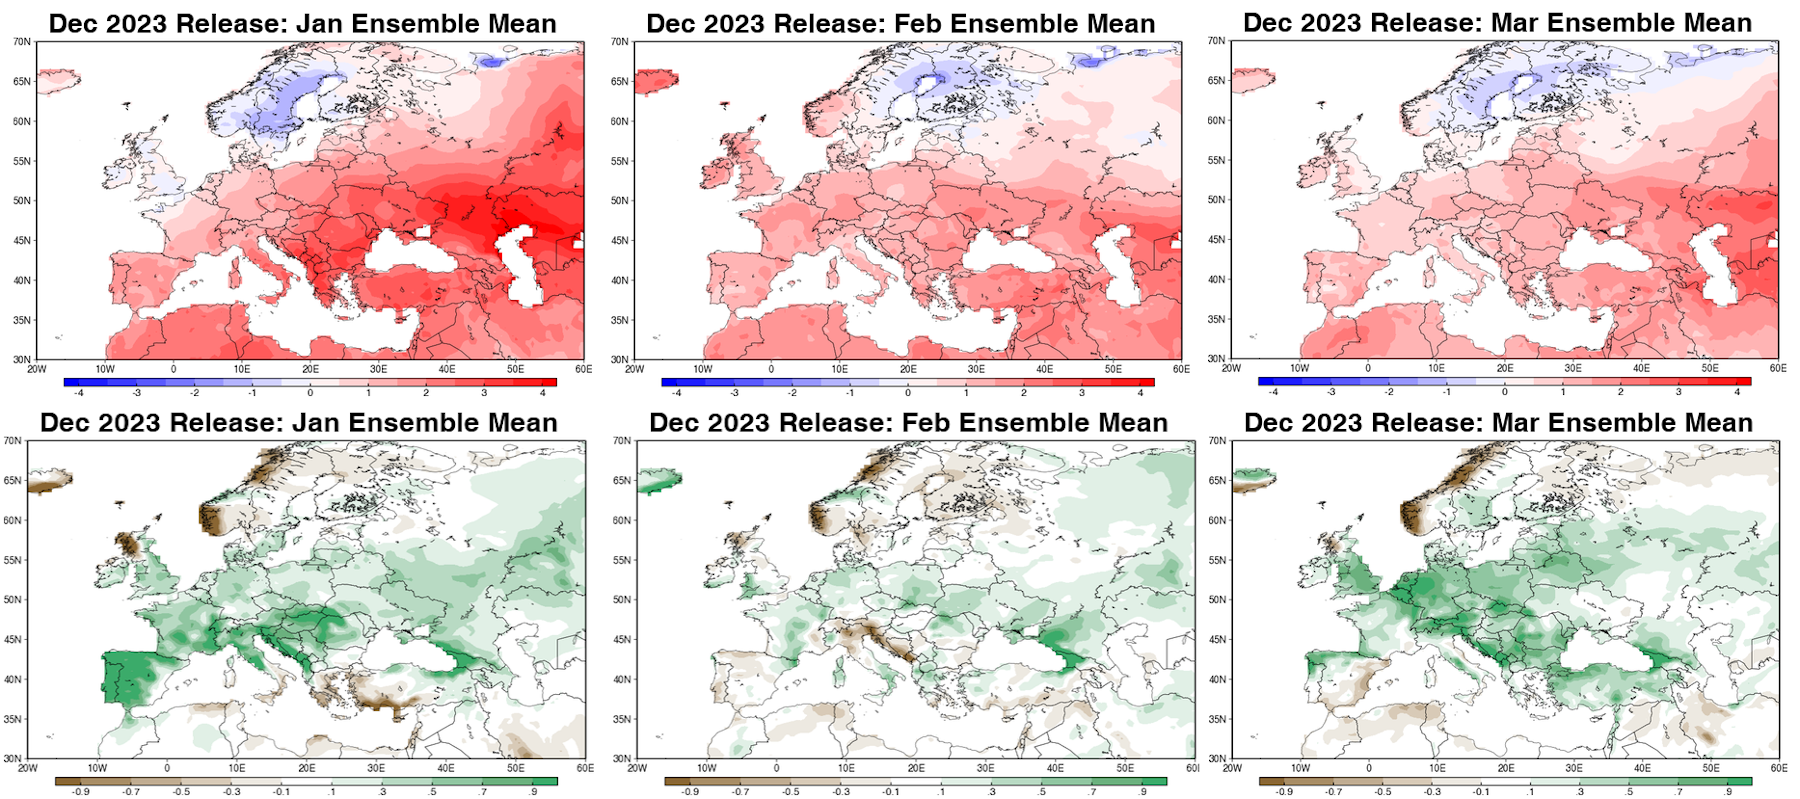
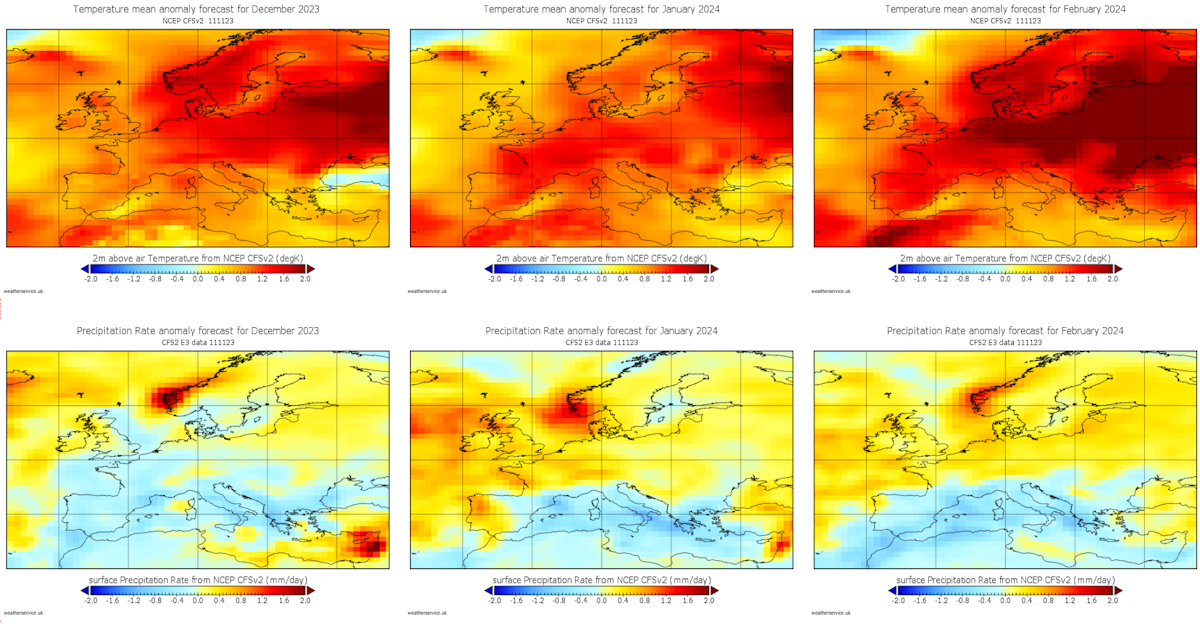
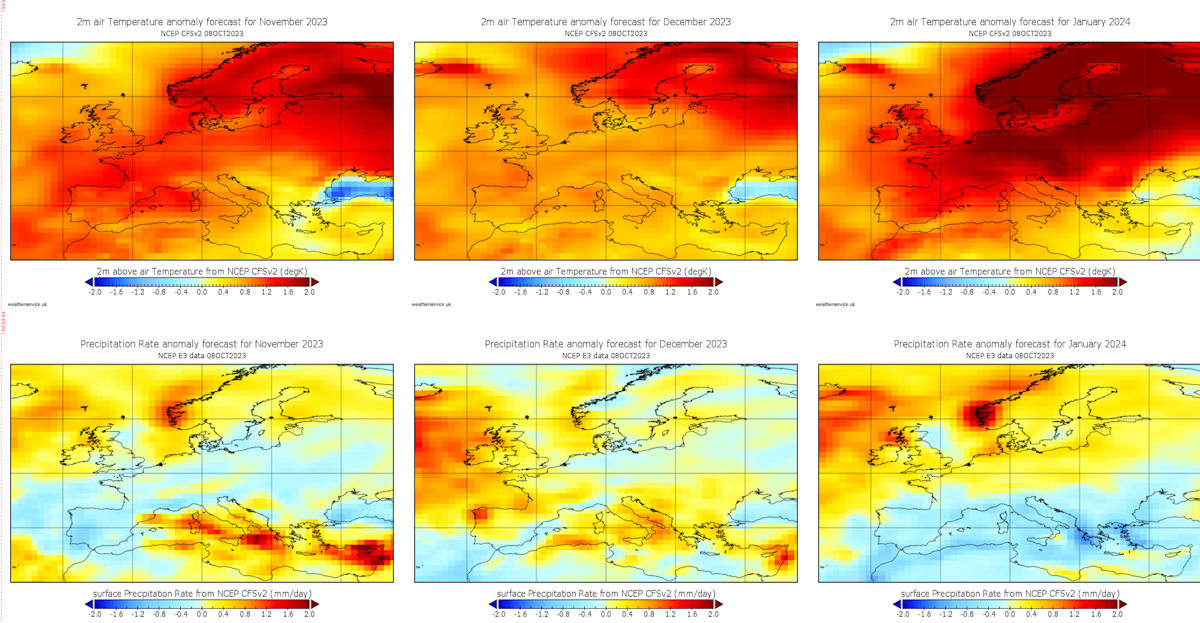
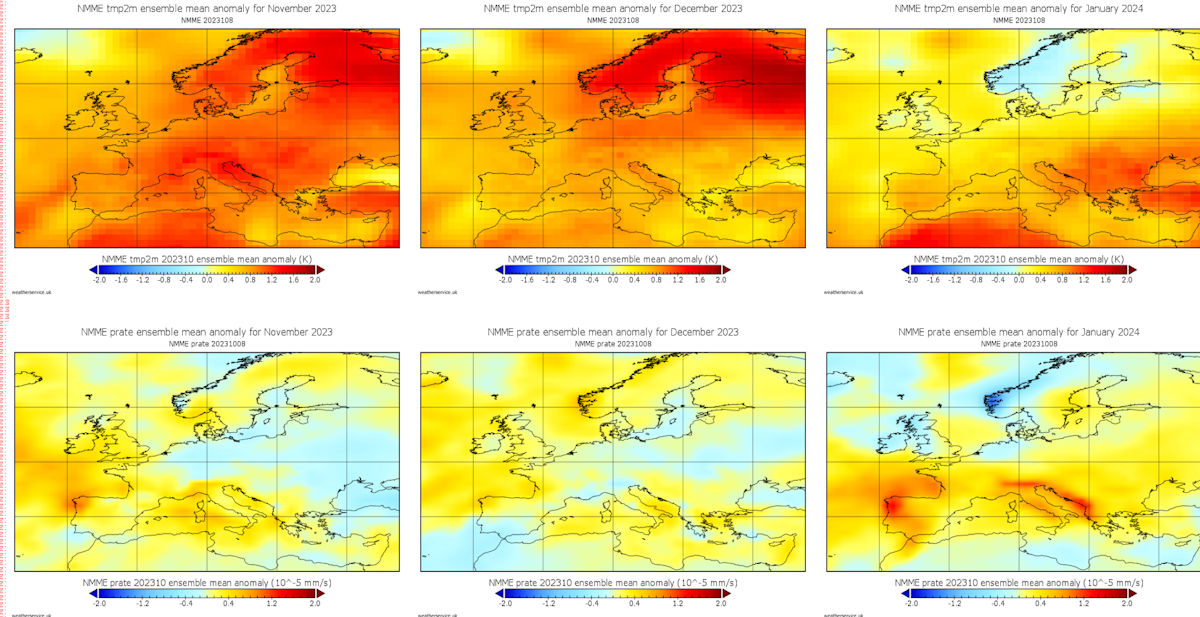
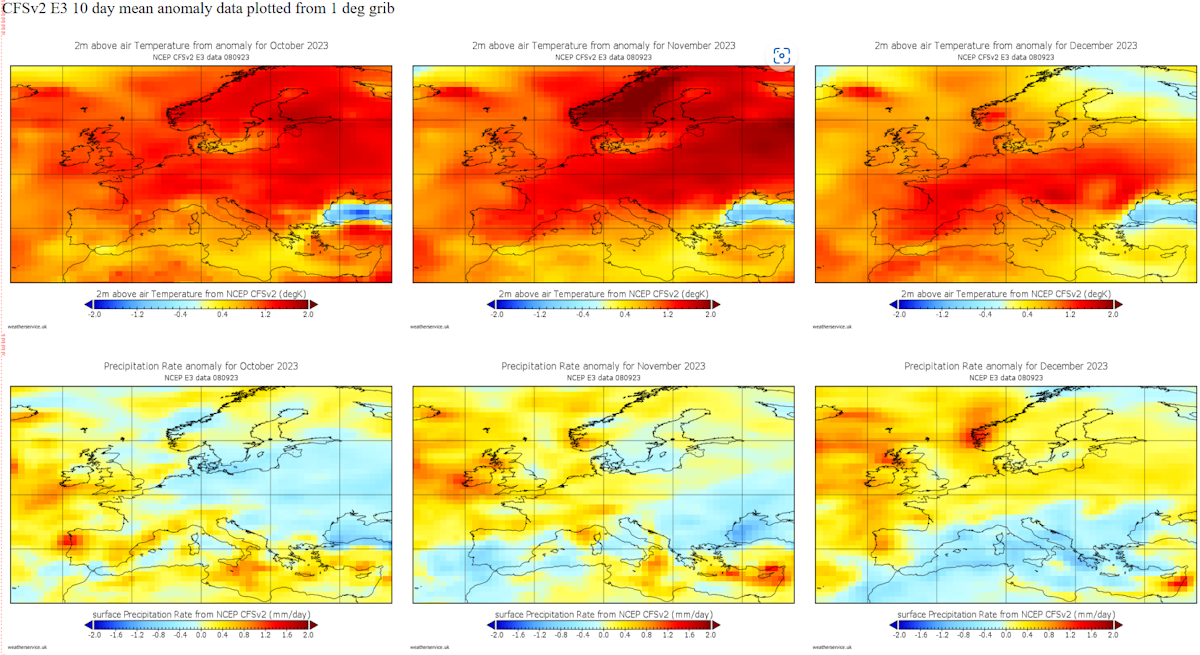
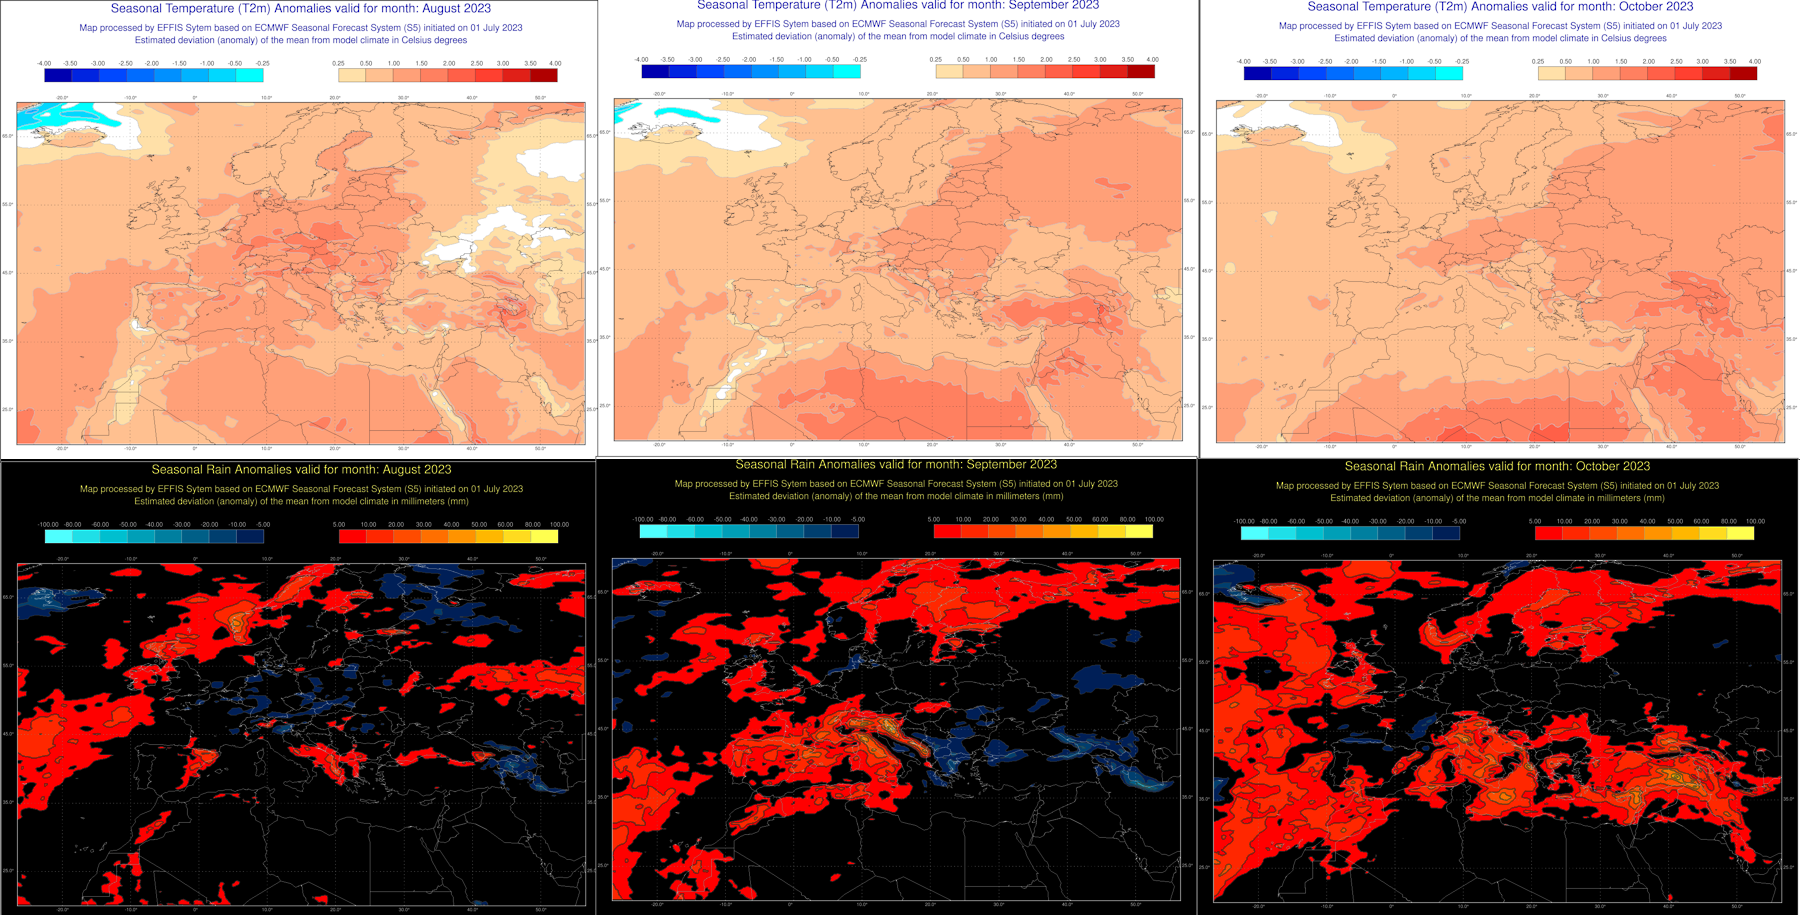
A selection of model solutions for May June July 2024 using April data are shown below. The full set can be found at https://www.weather-info.co.uk/wxsvc/seaslatest.html
Top row temperature anomaly. Lower row precipitation anomaly
May to July 2024


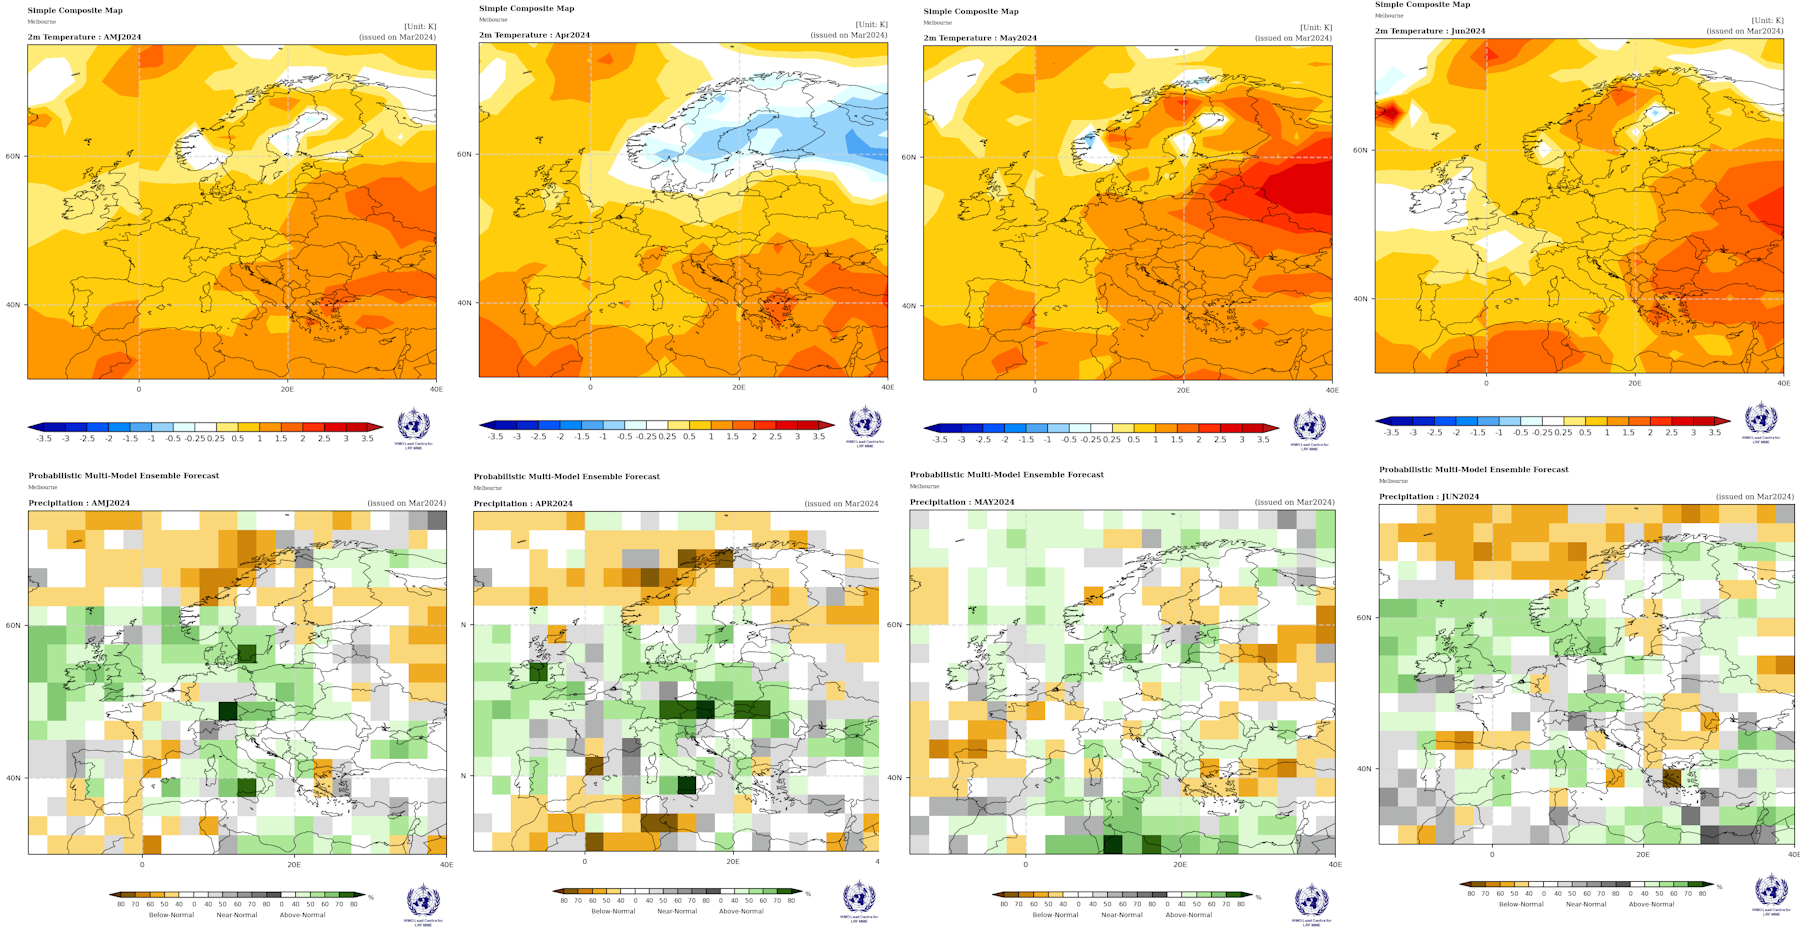
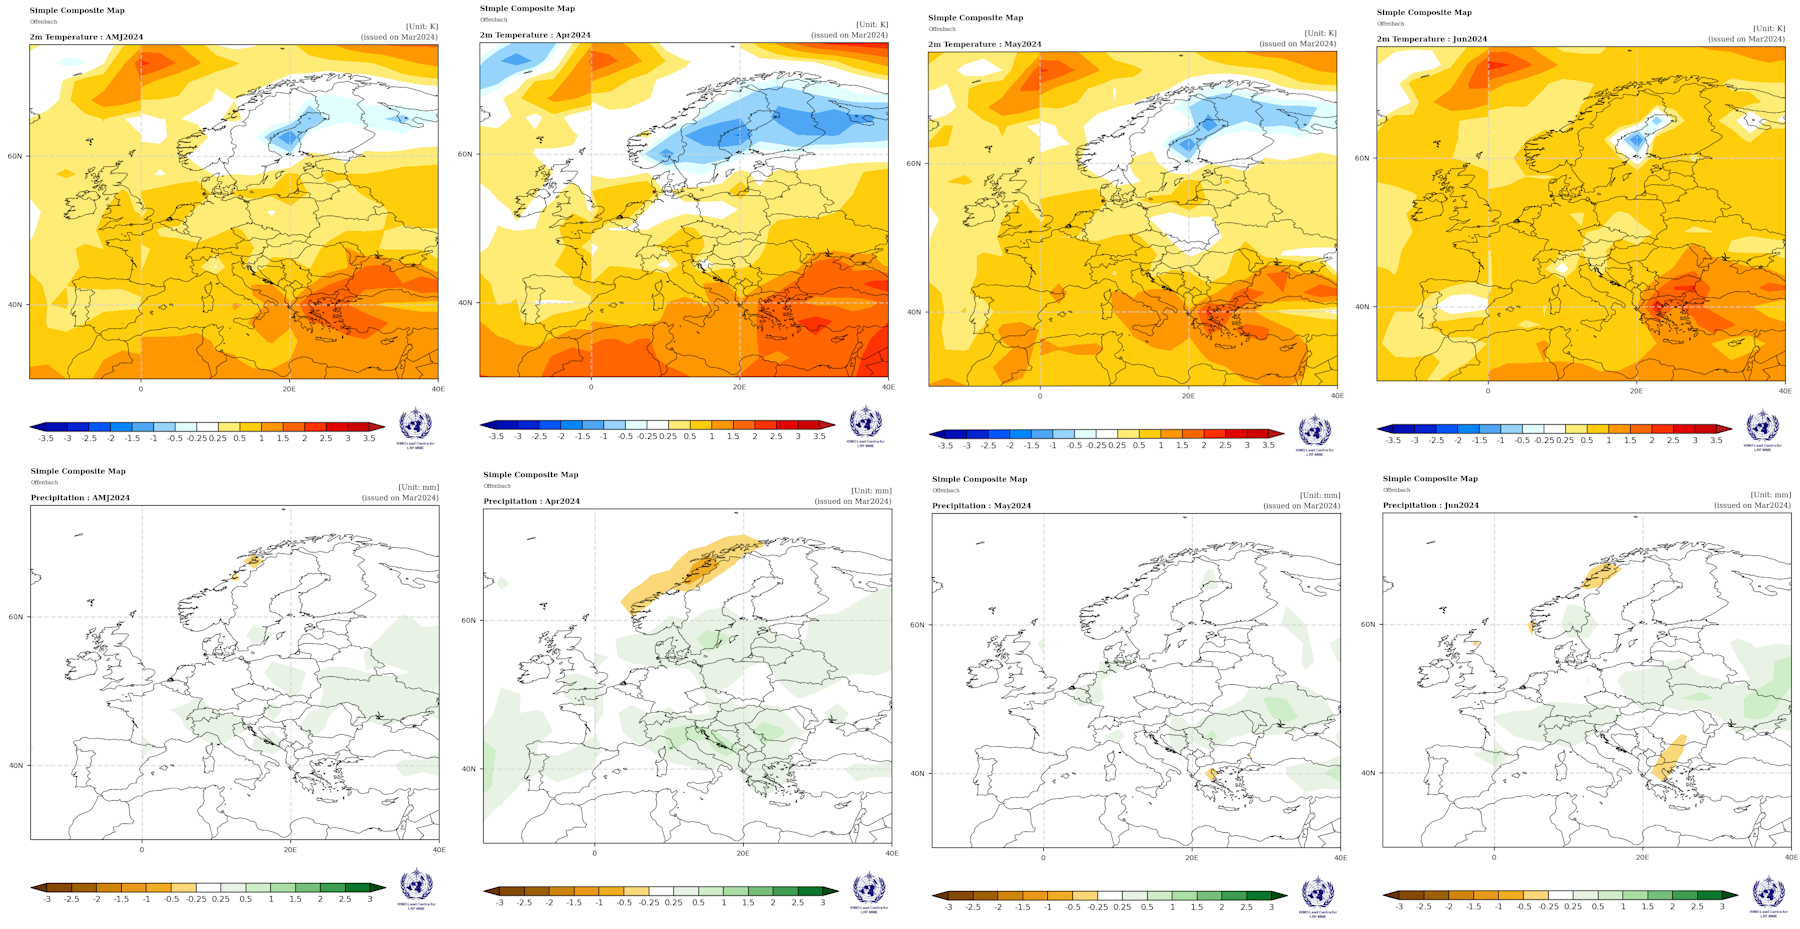
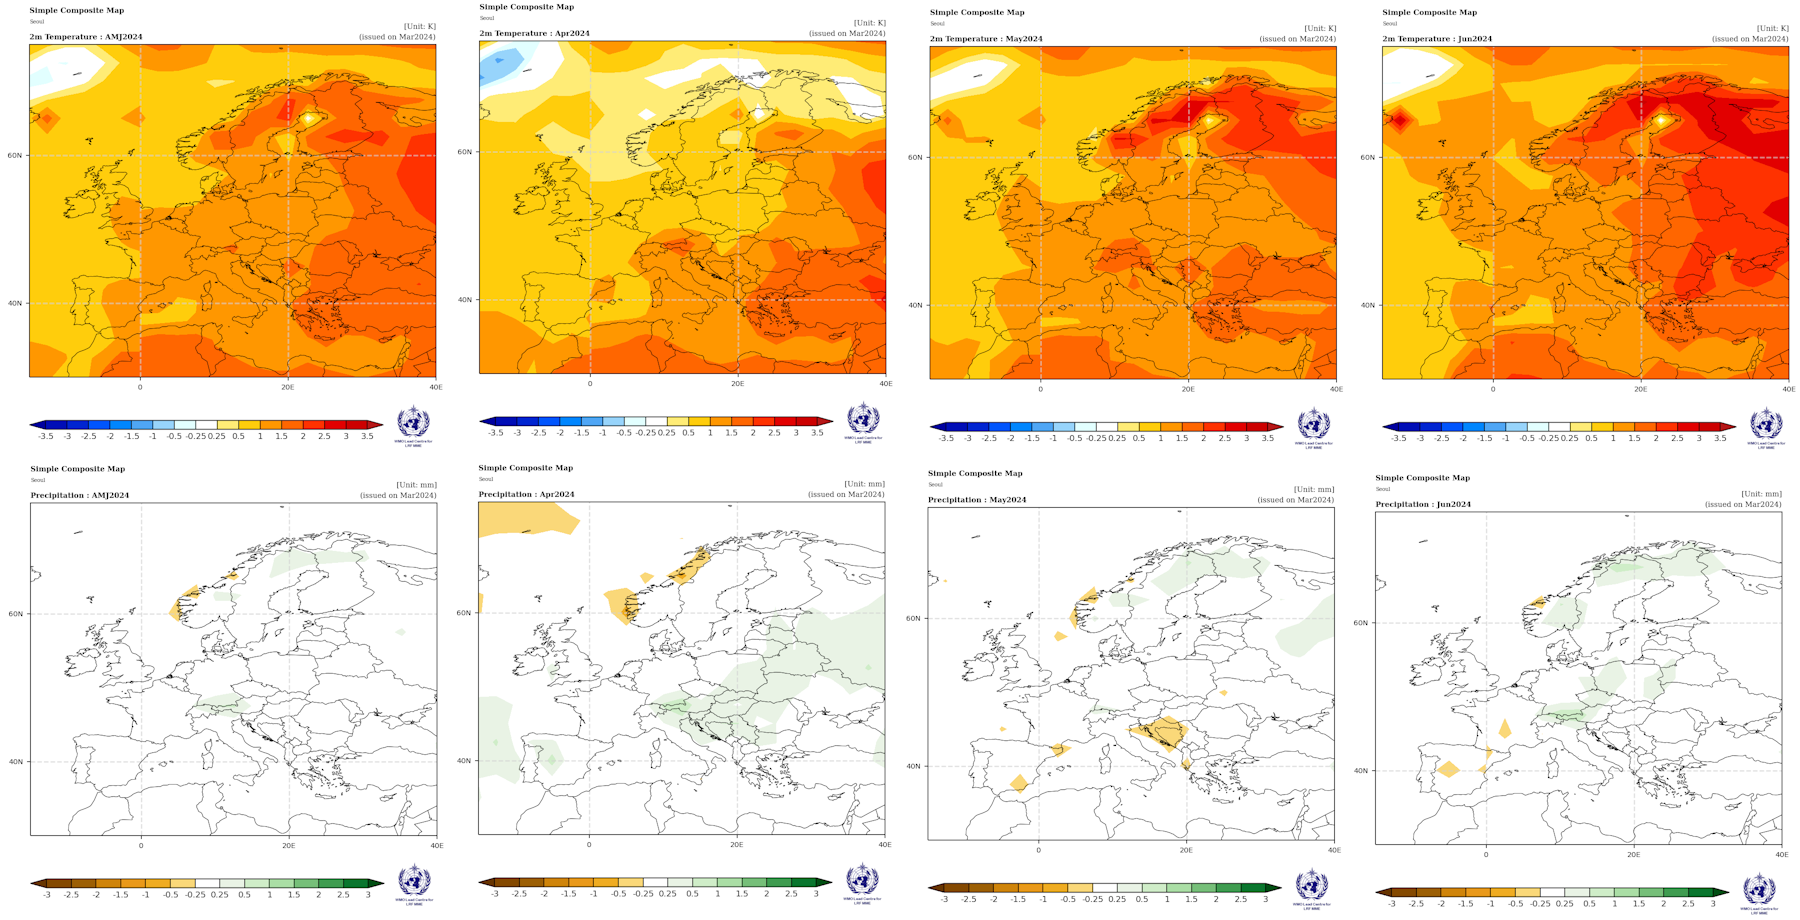
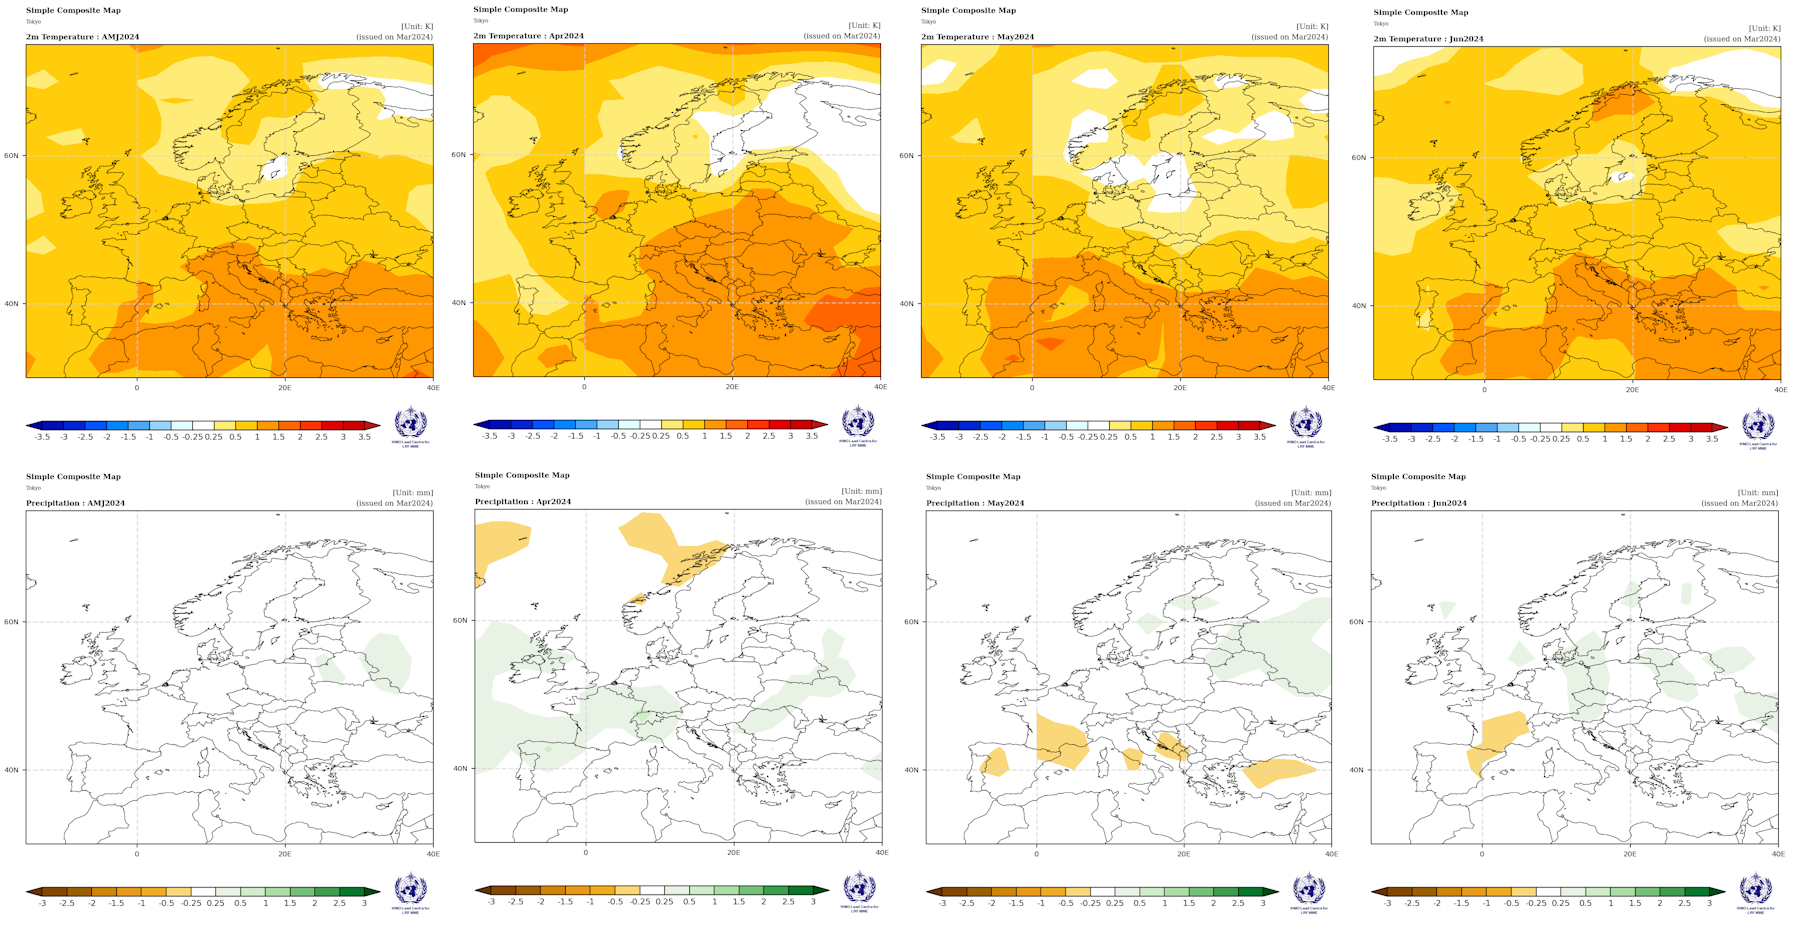
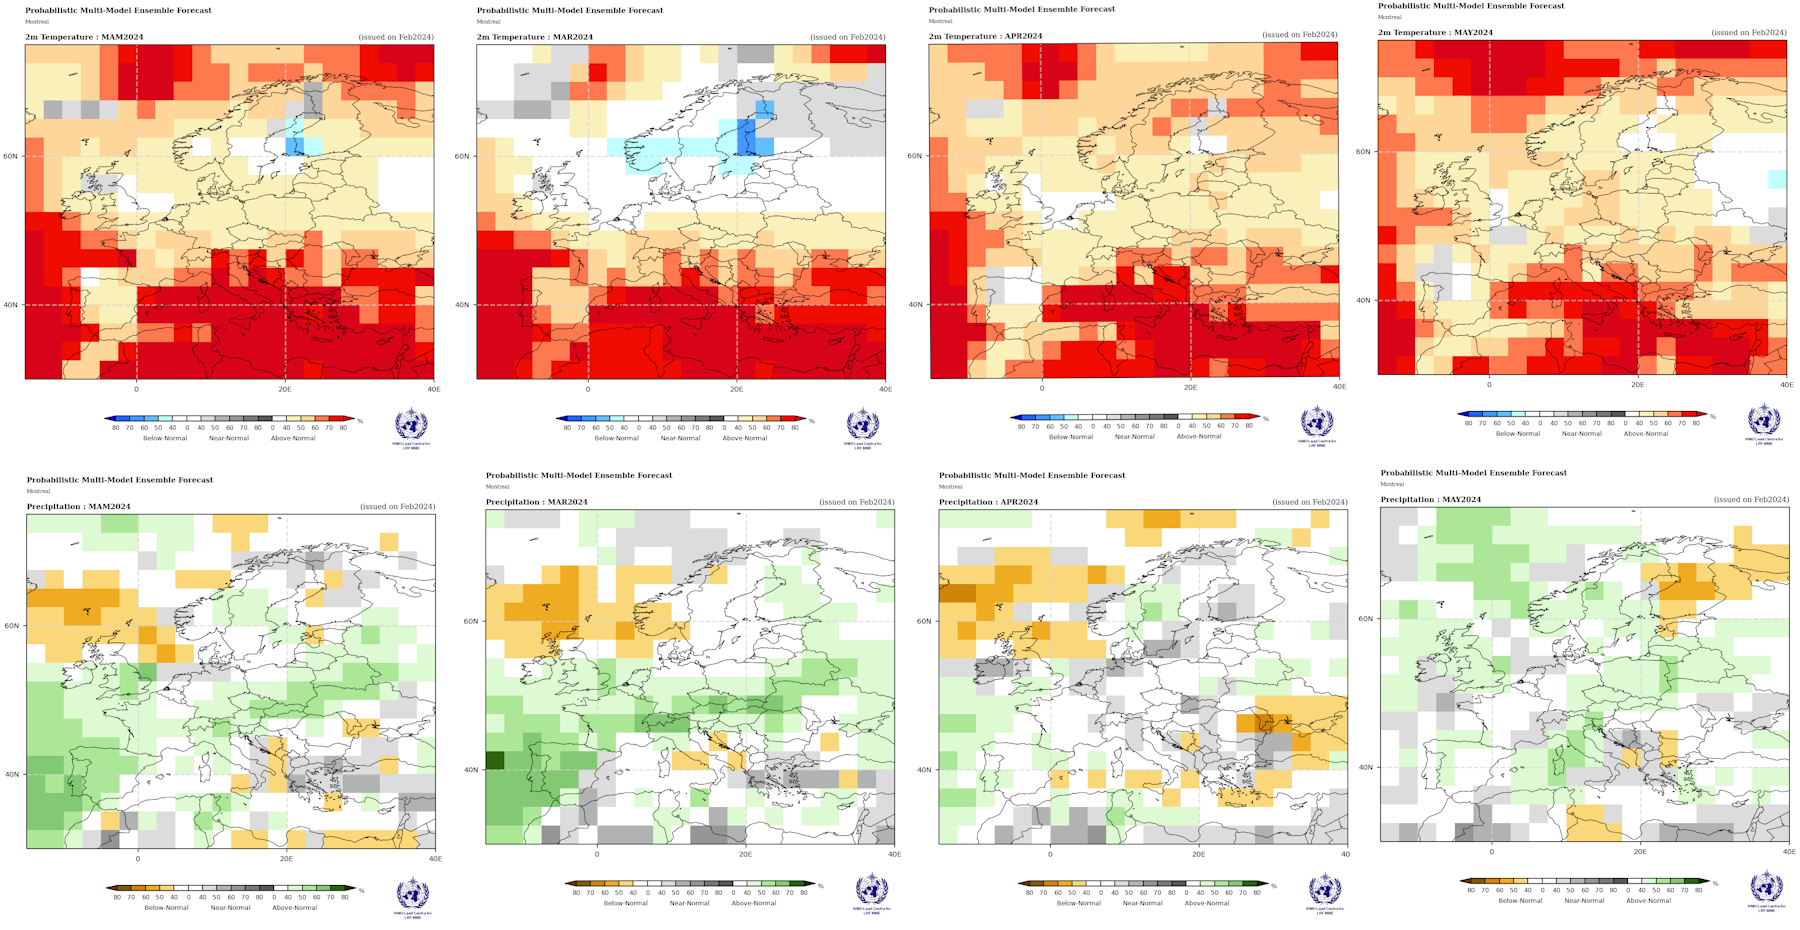
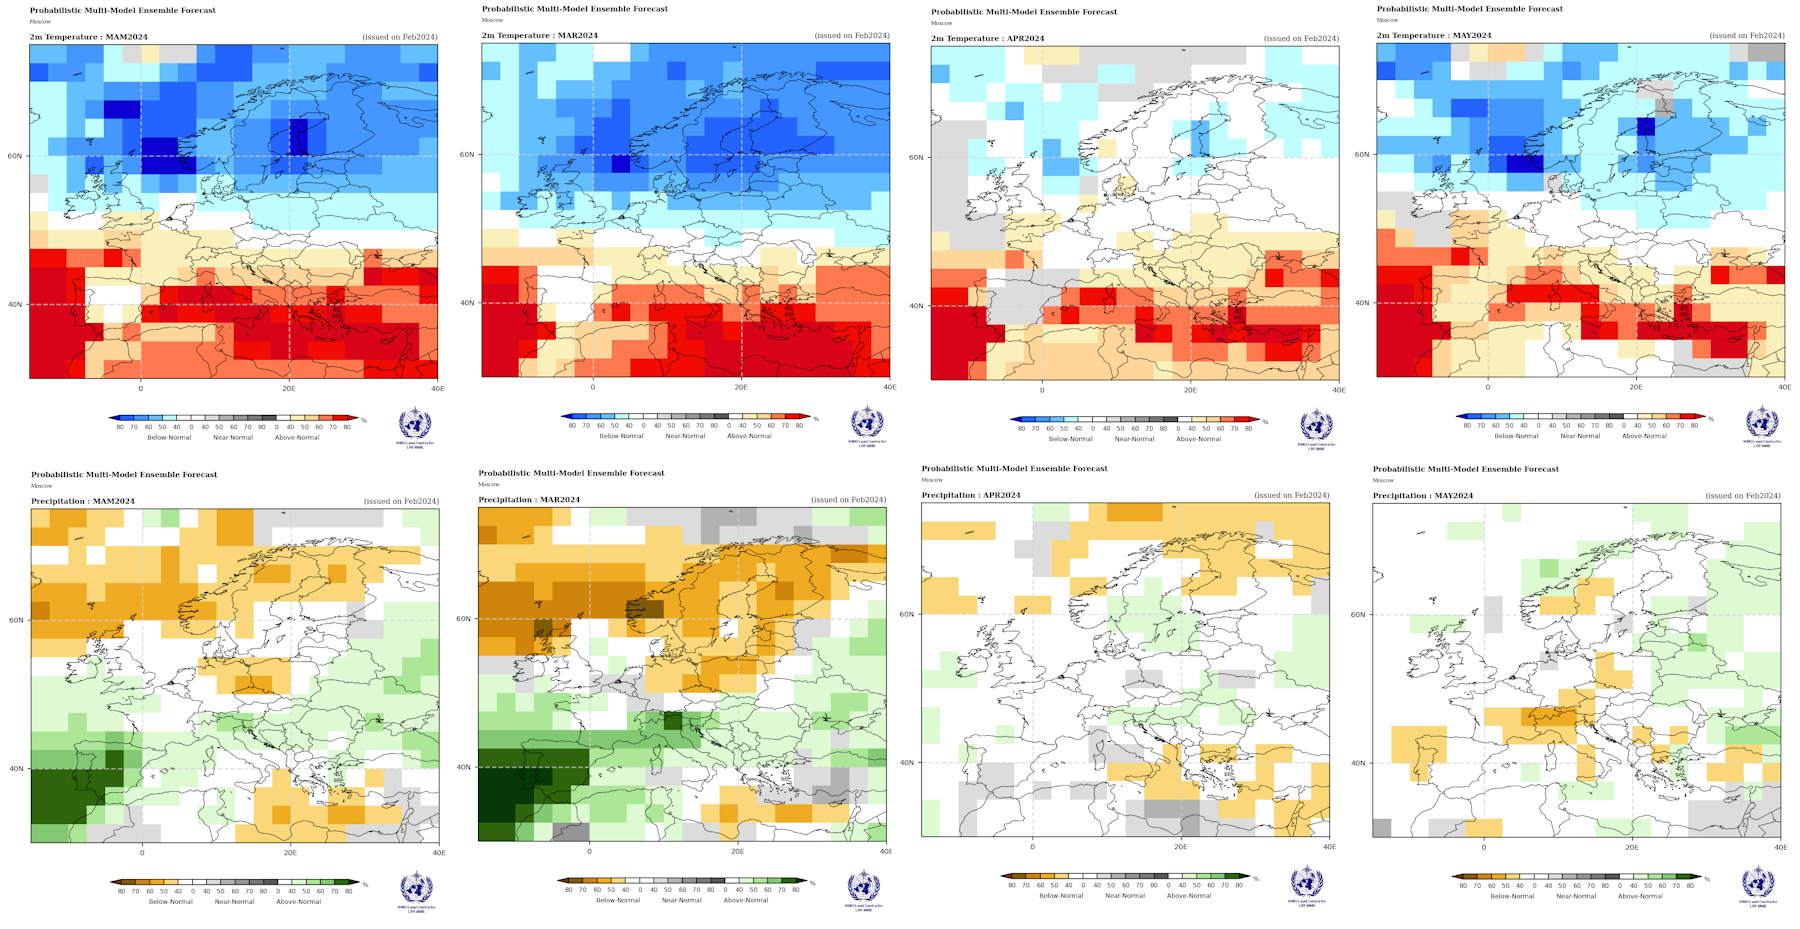
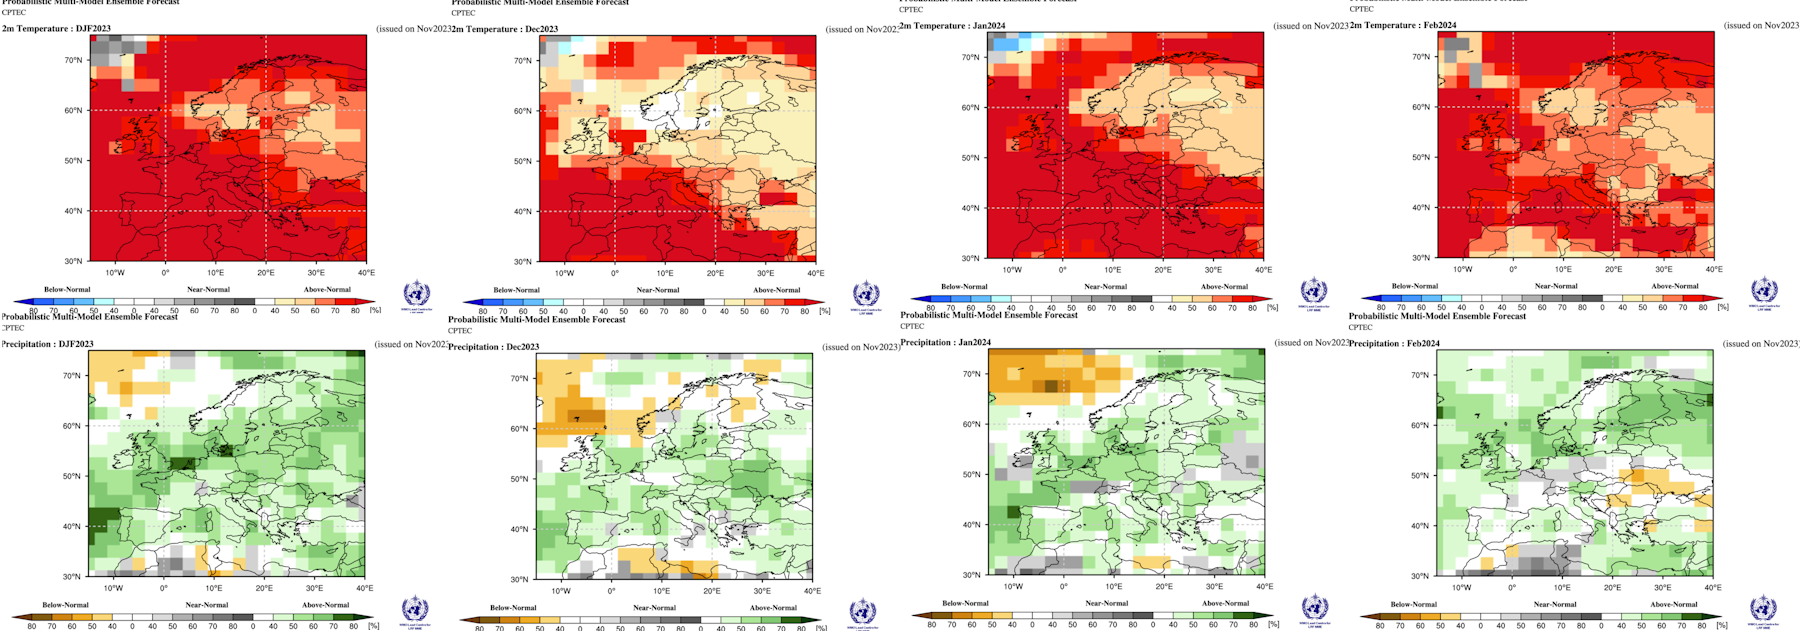
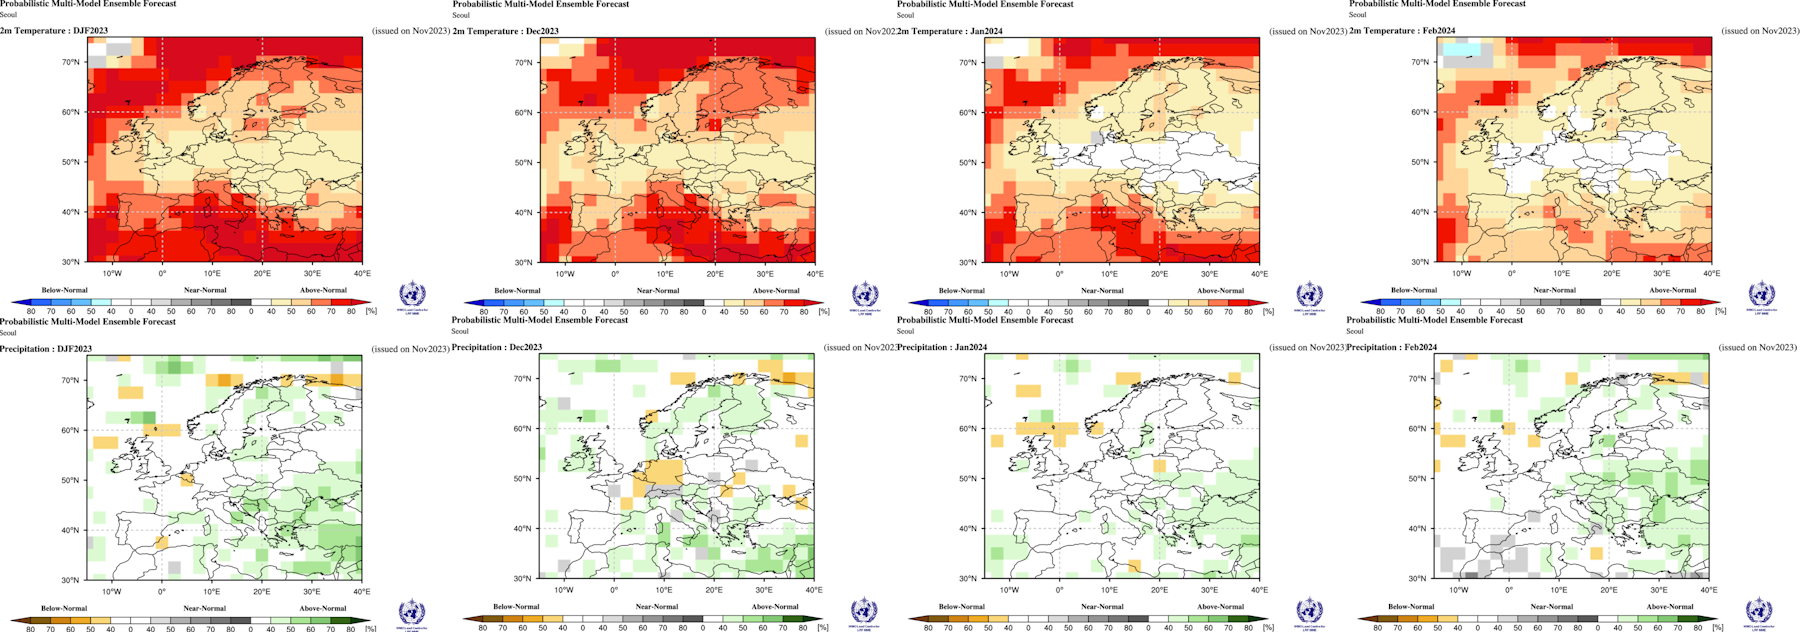
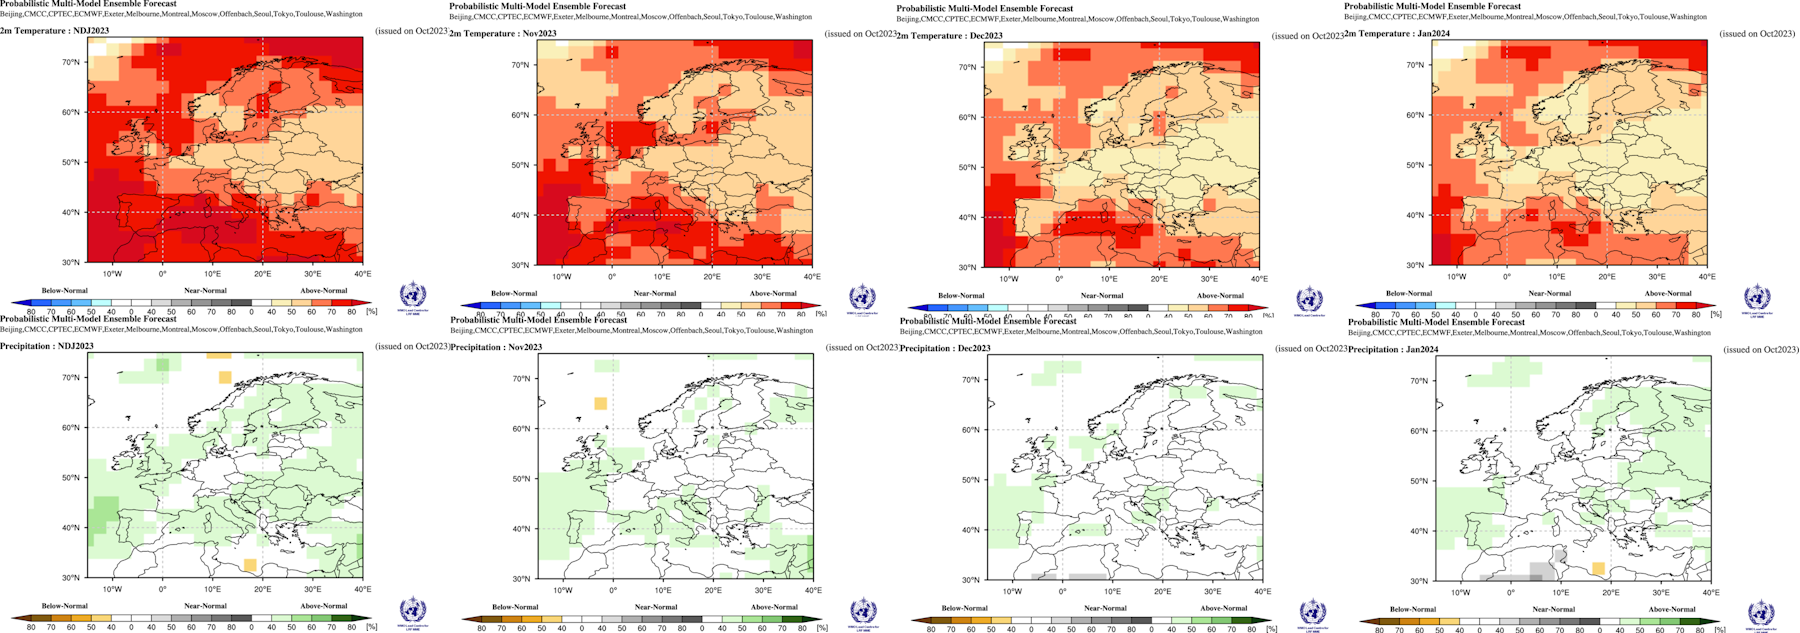
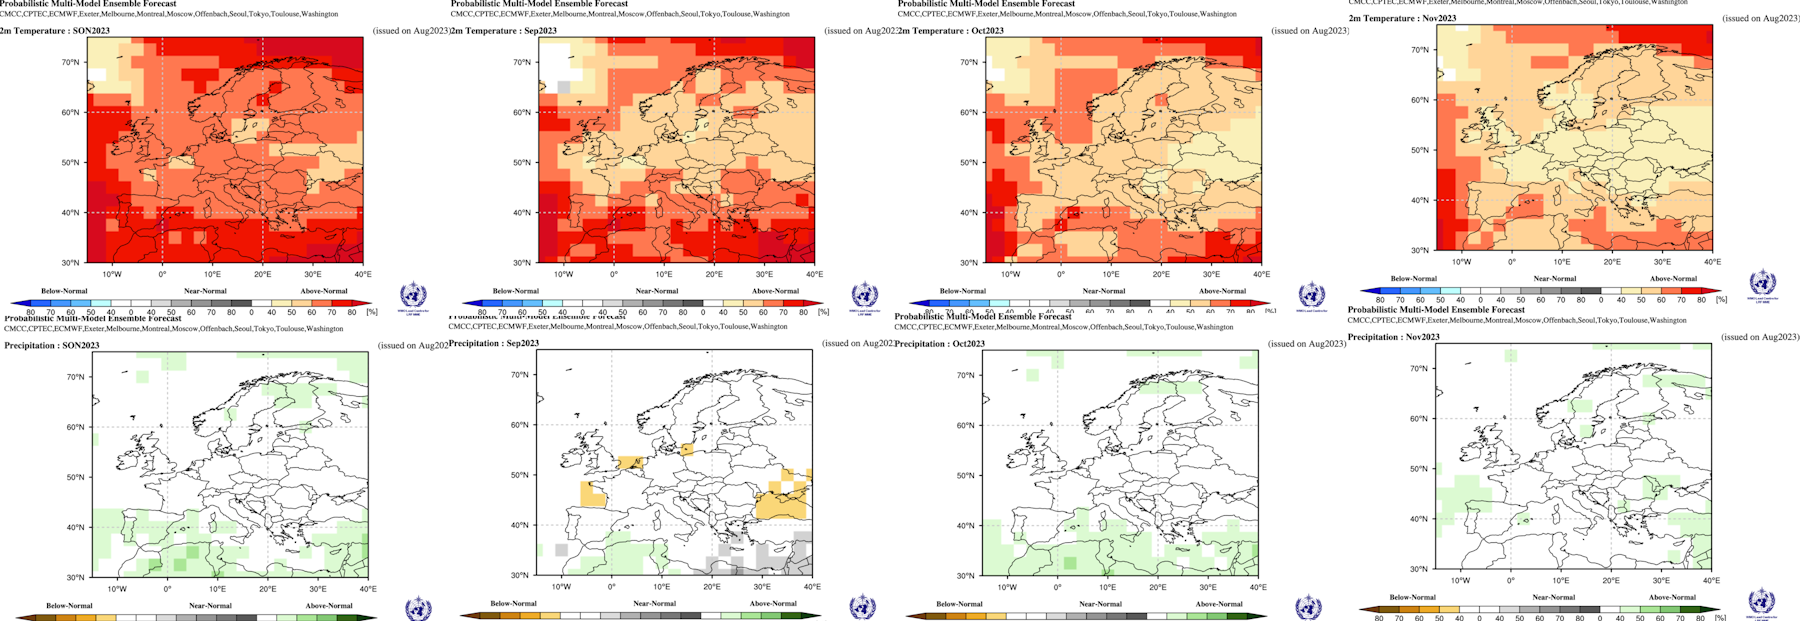
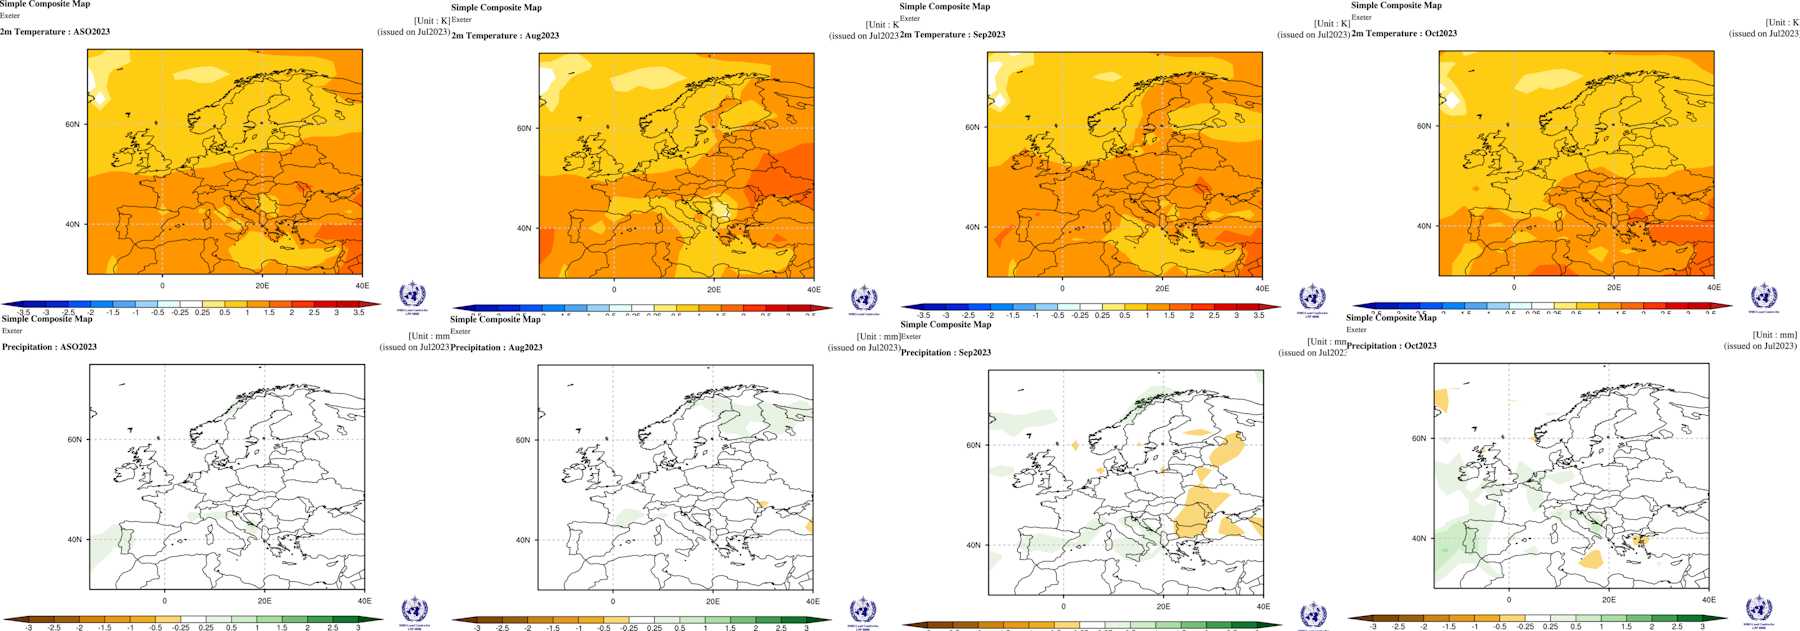
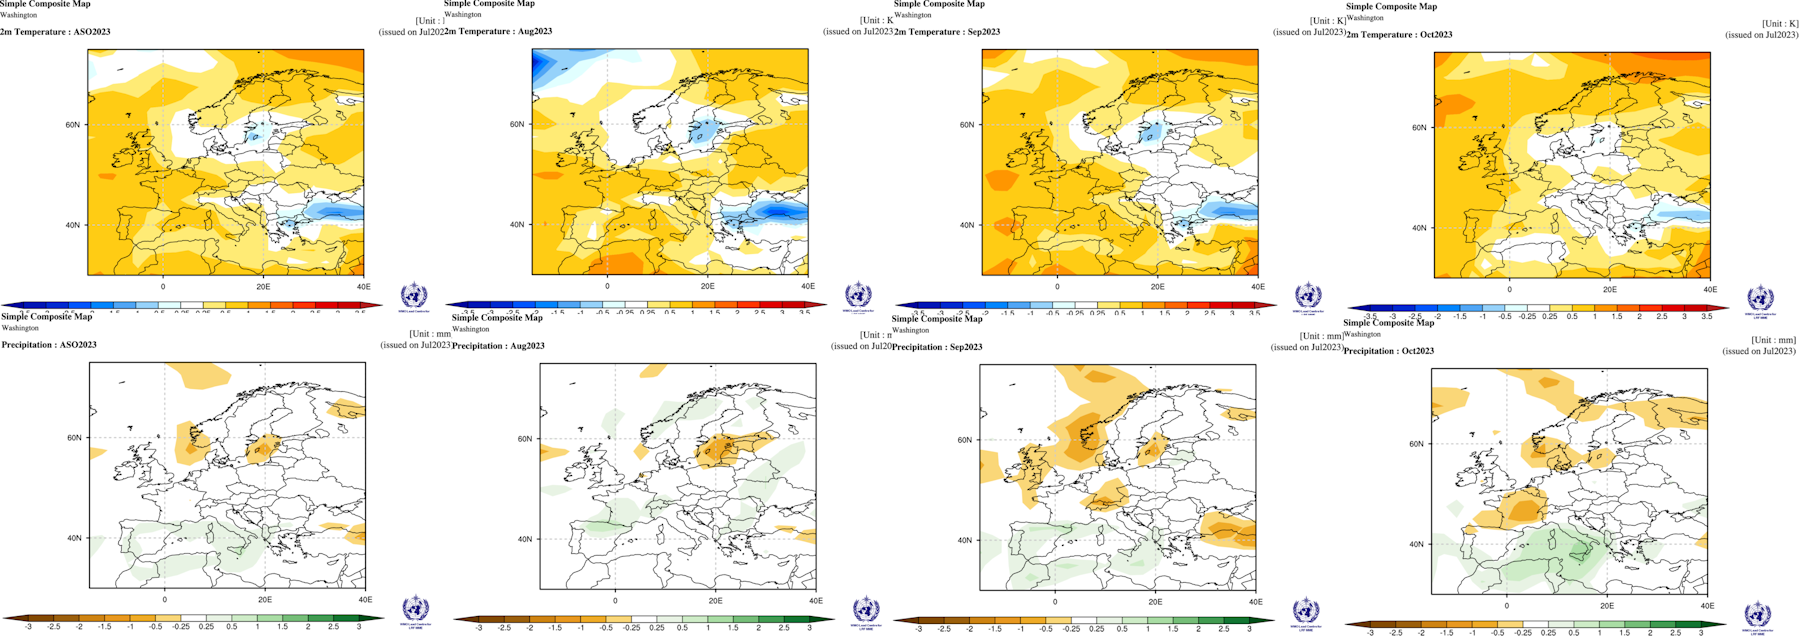
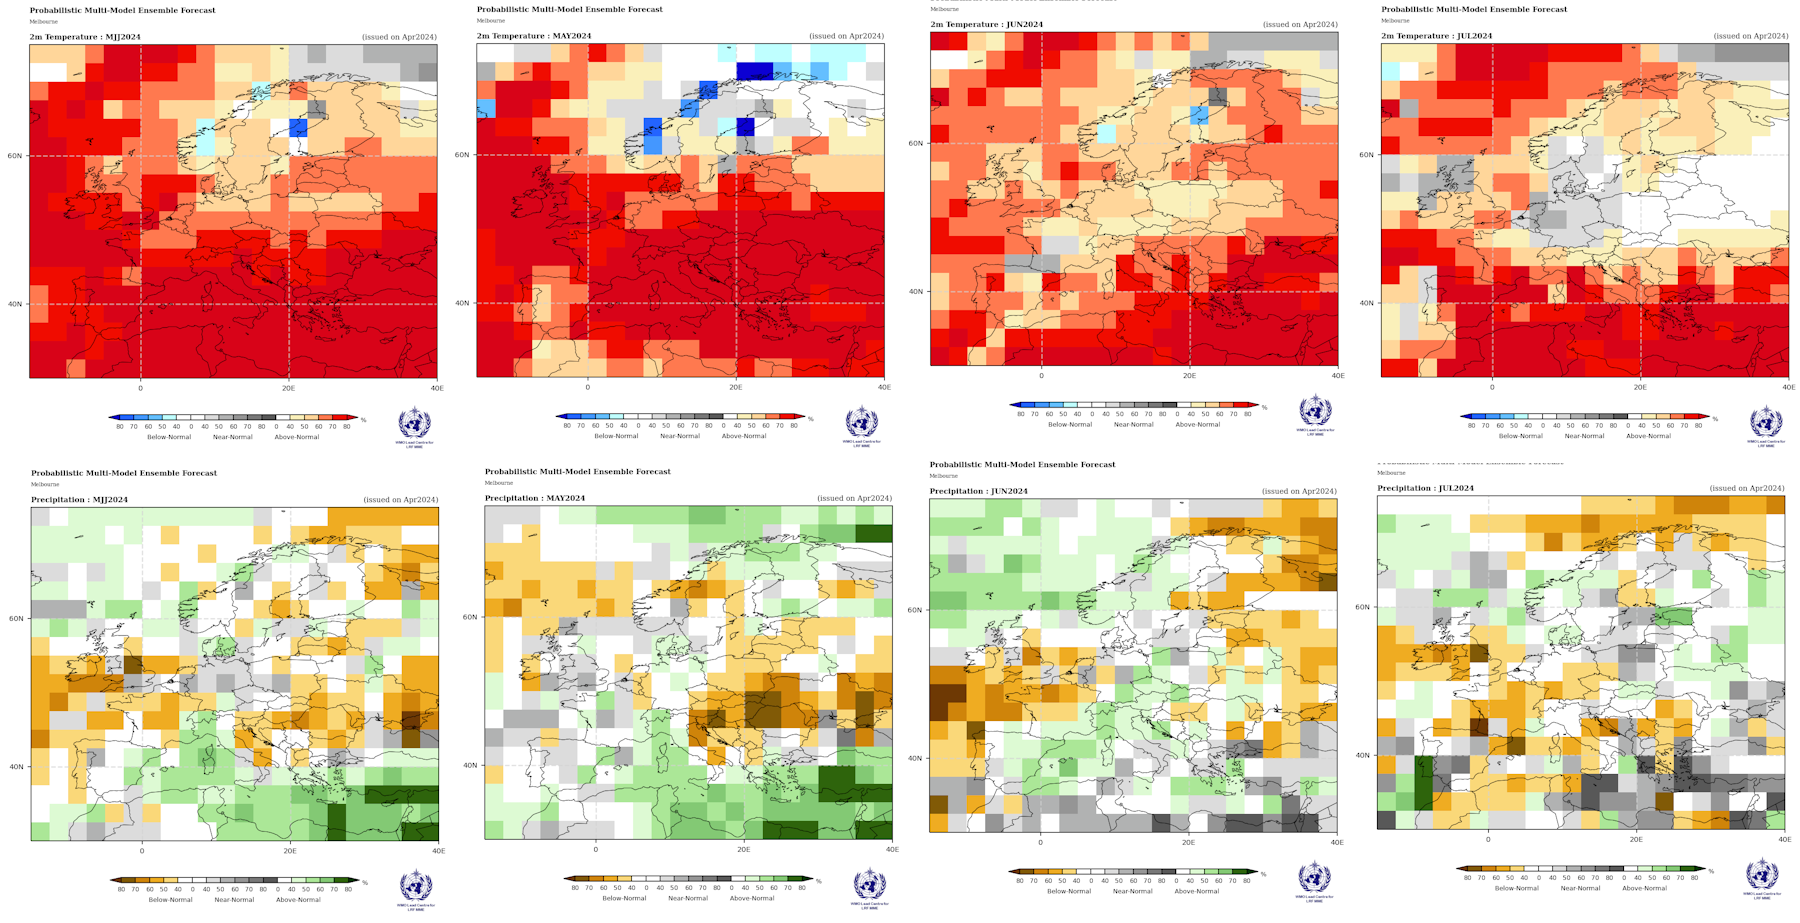
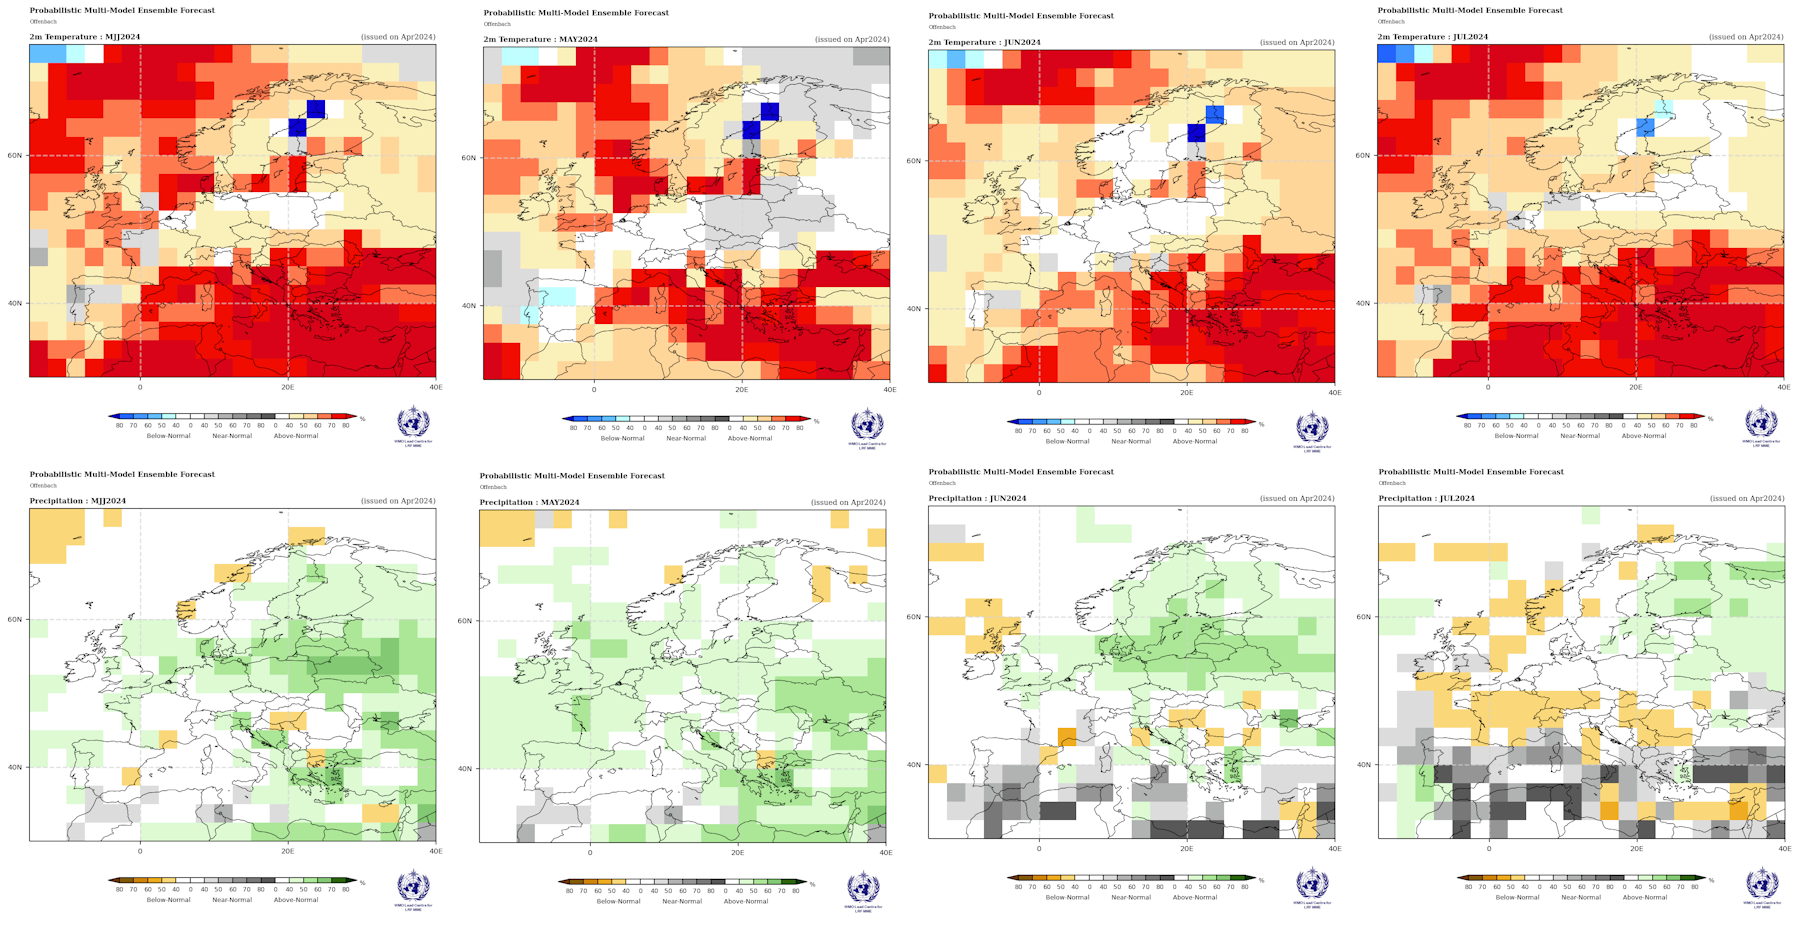
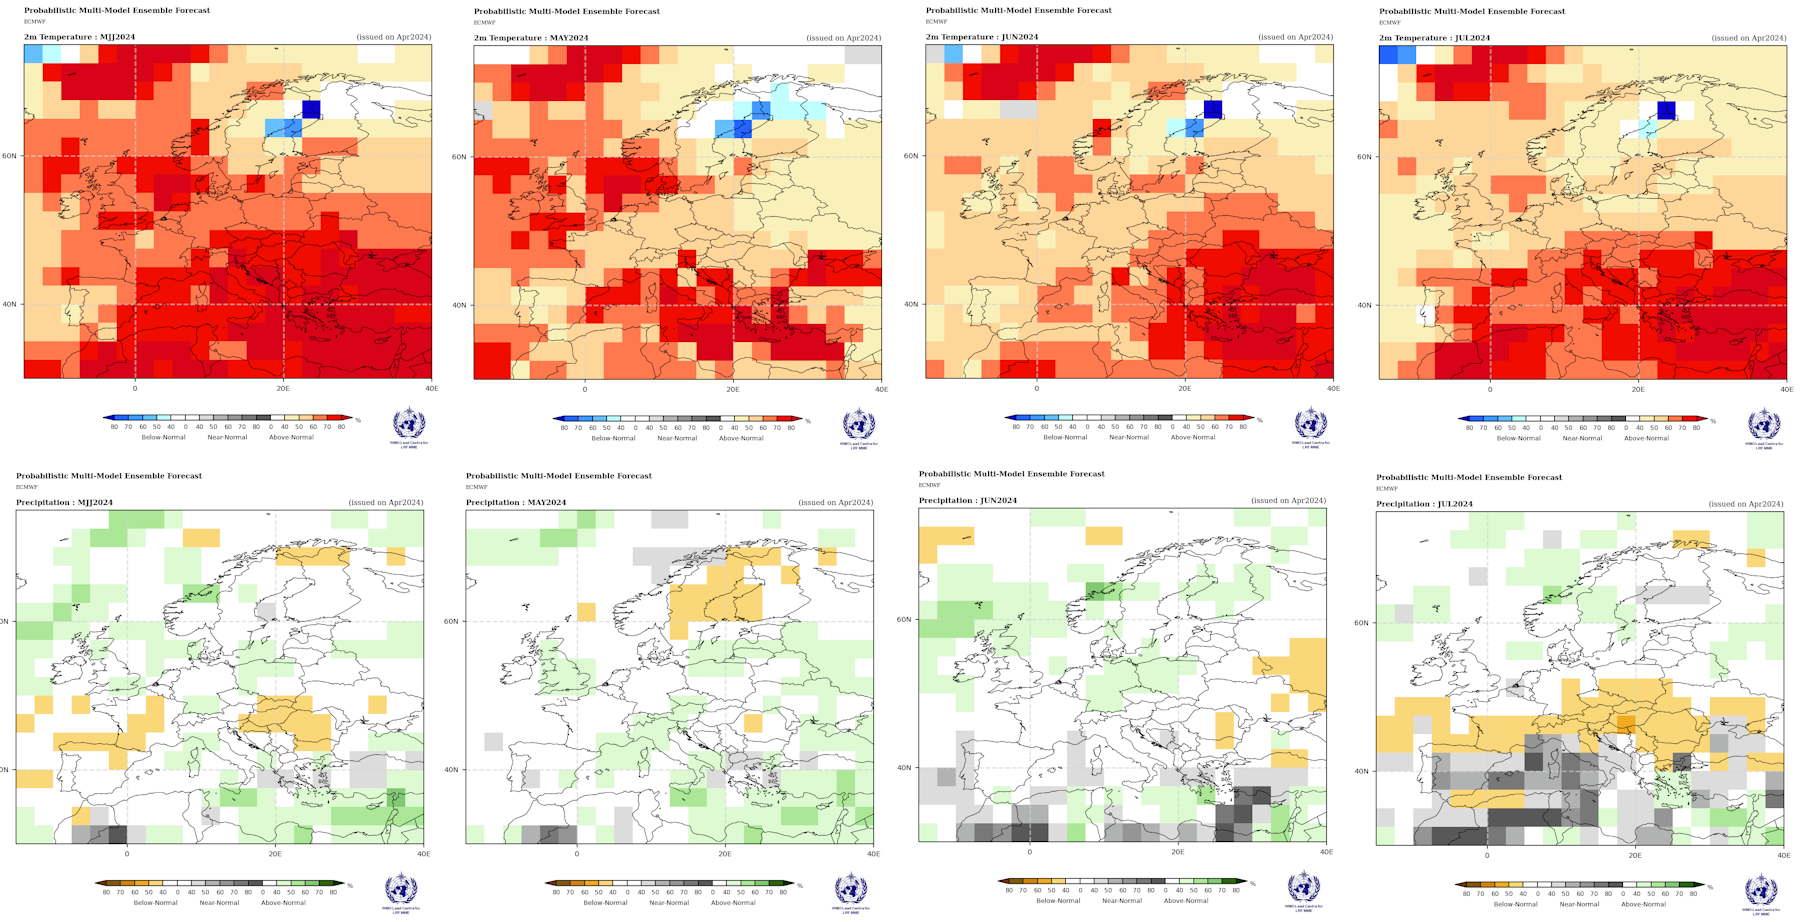
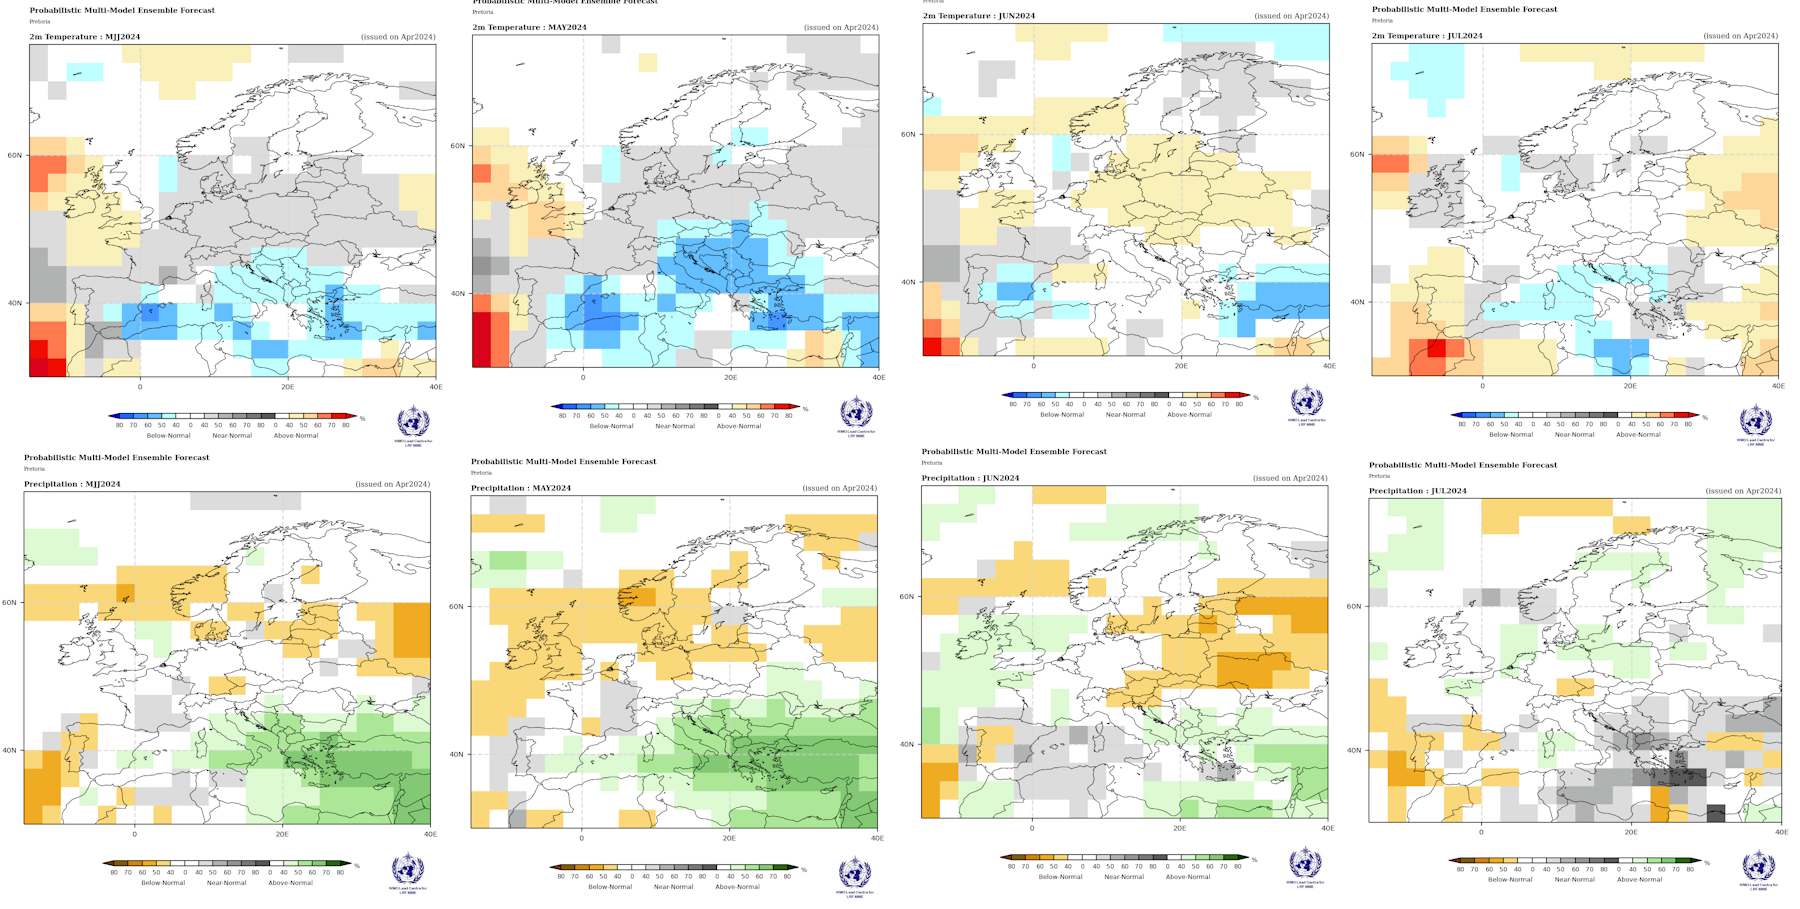
Data from WMO:
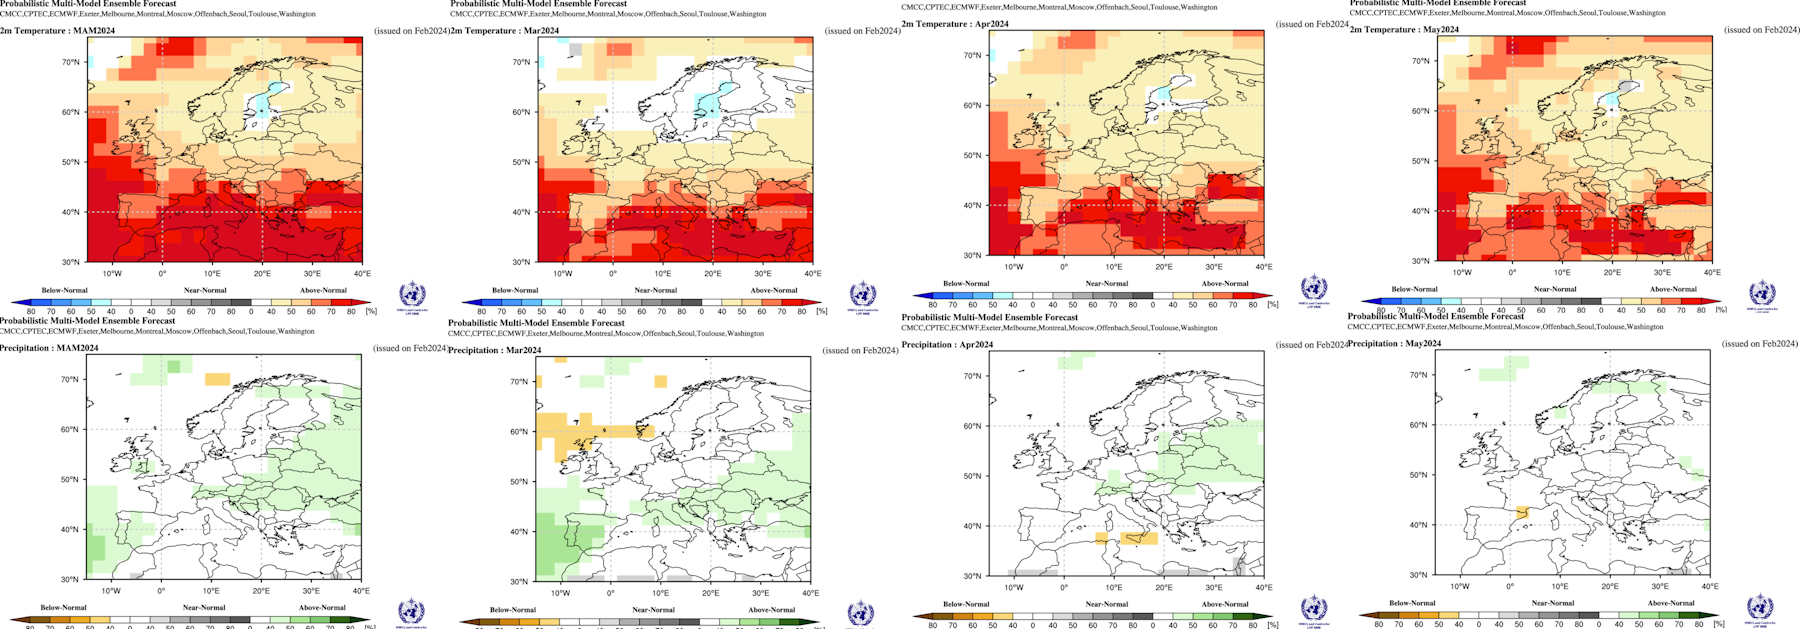
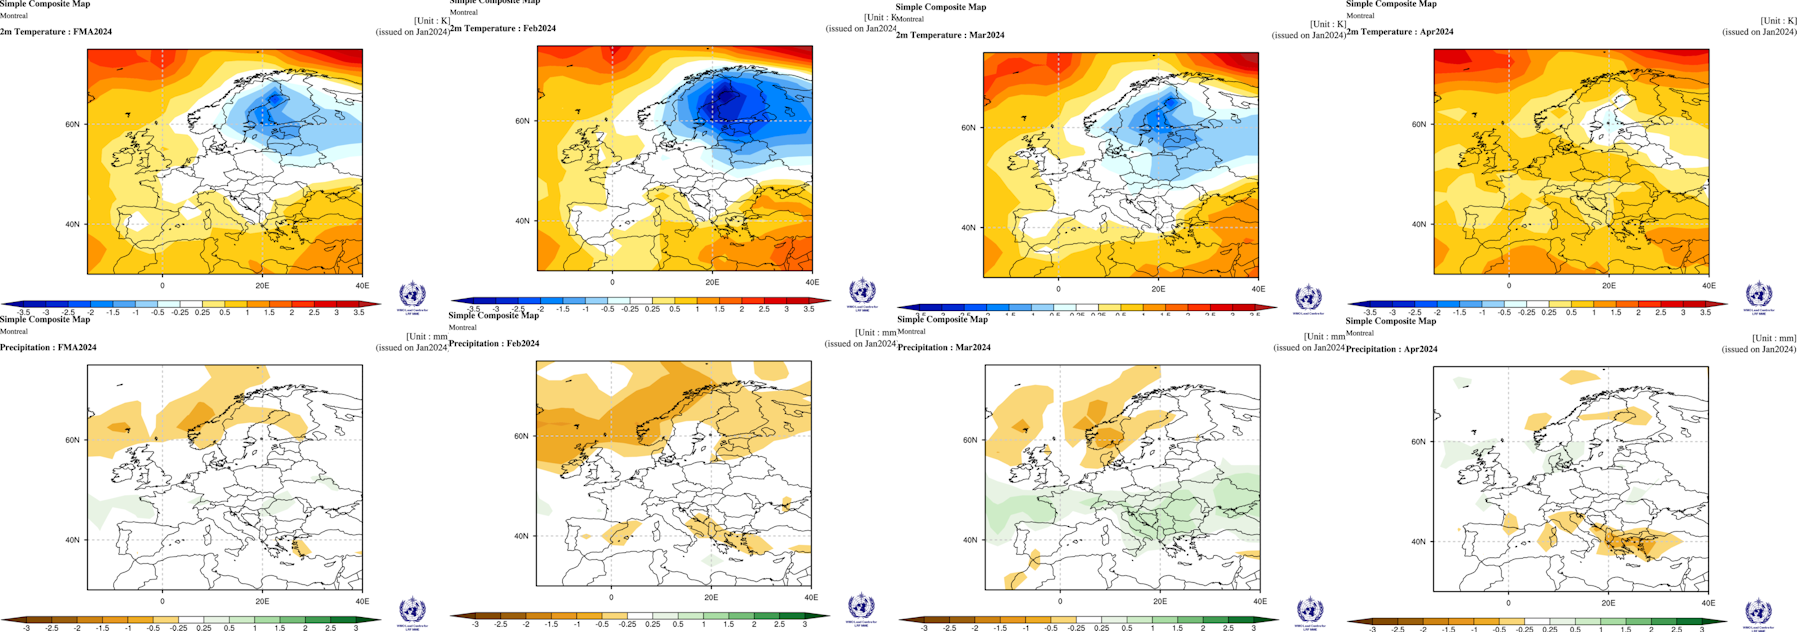
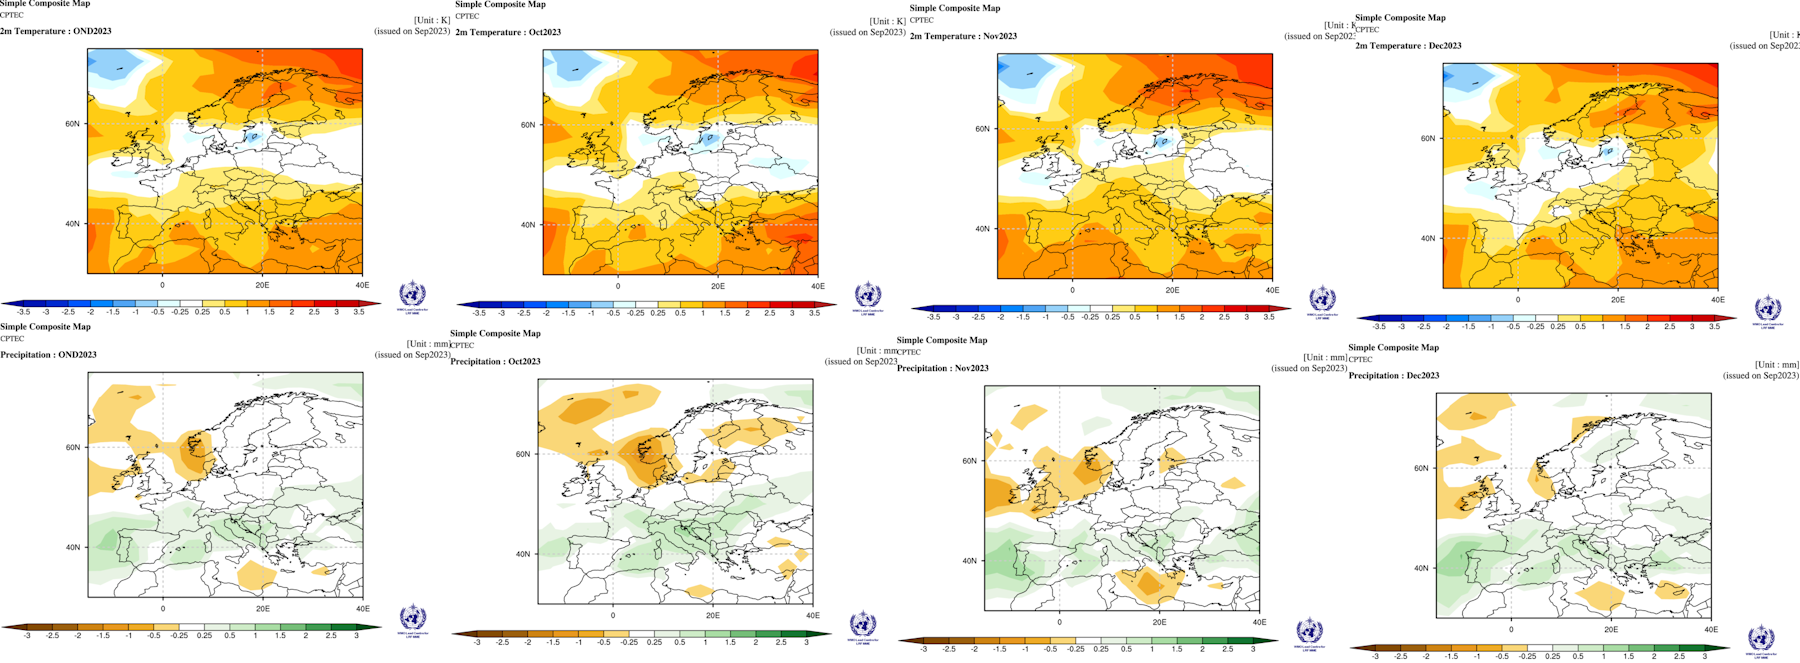
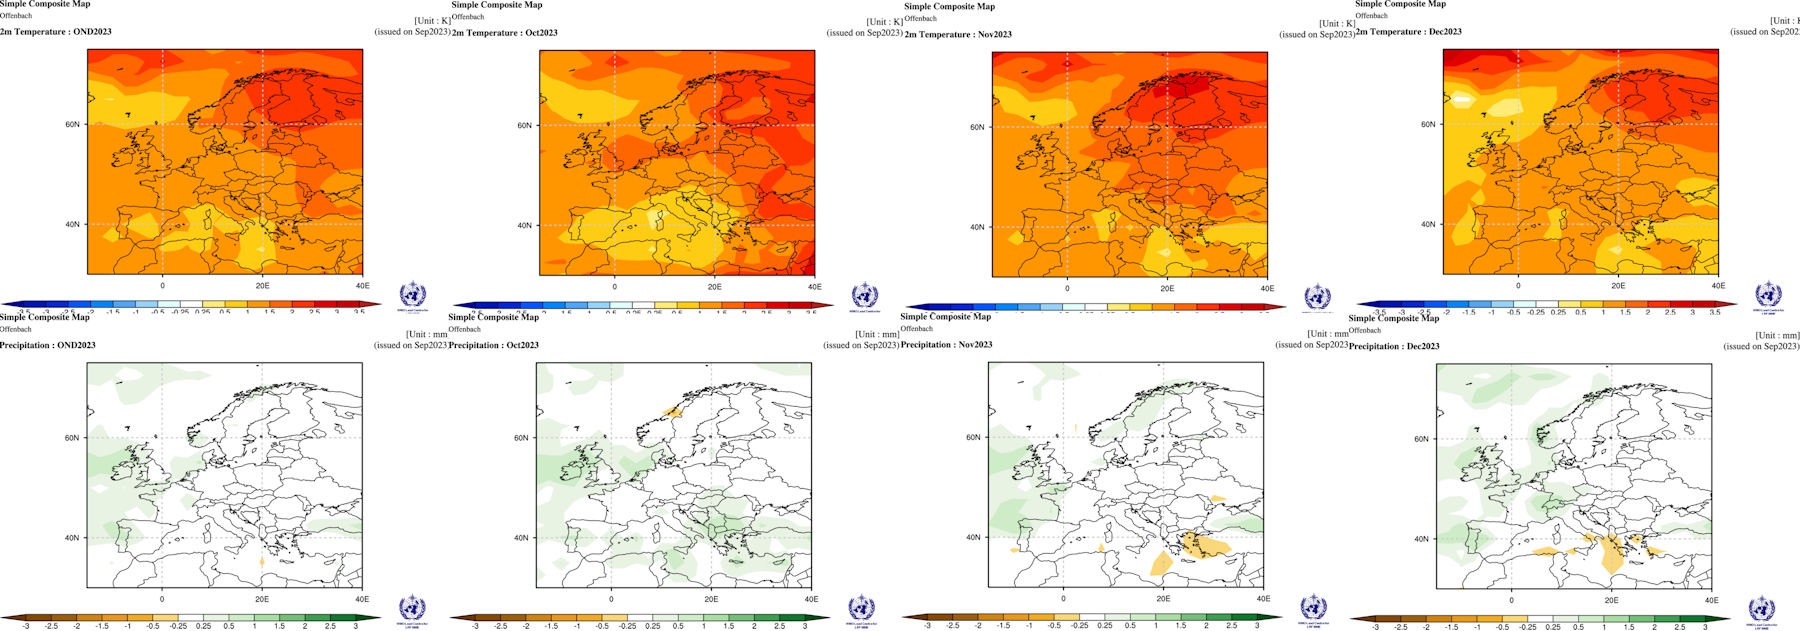
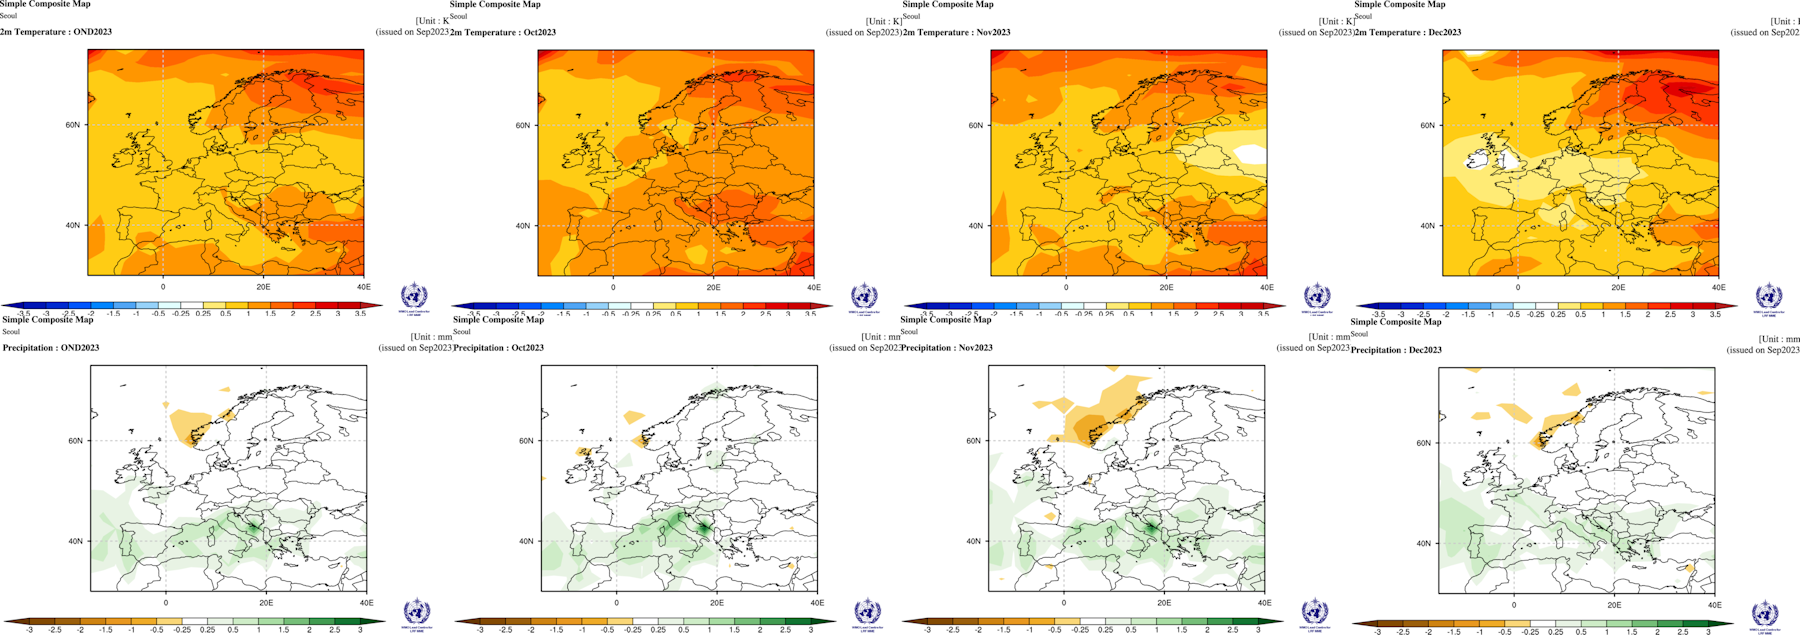
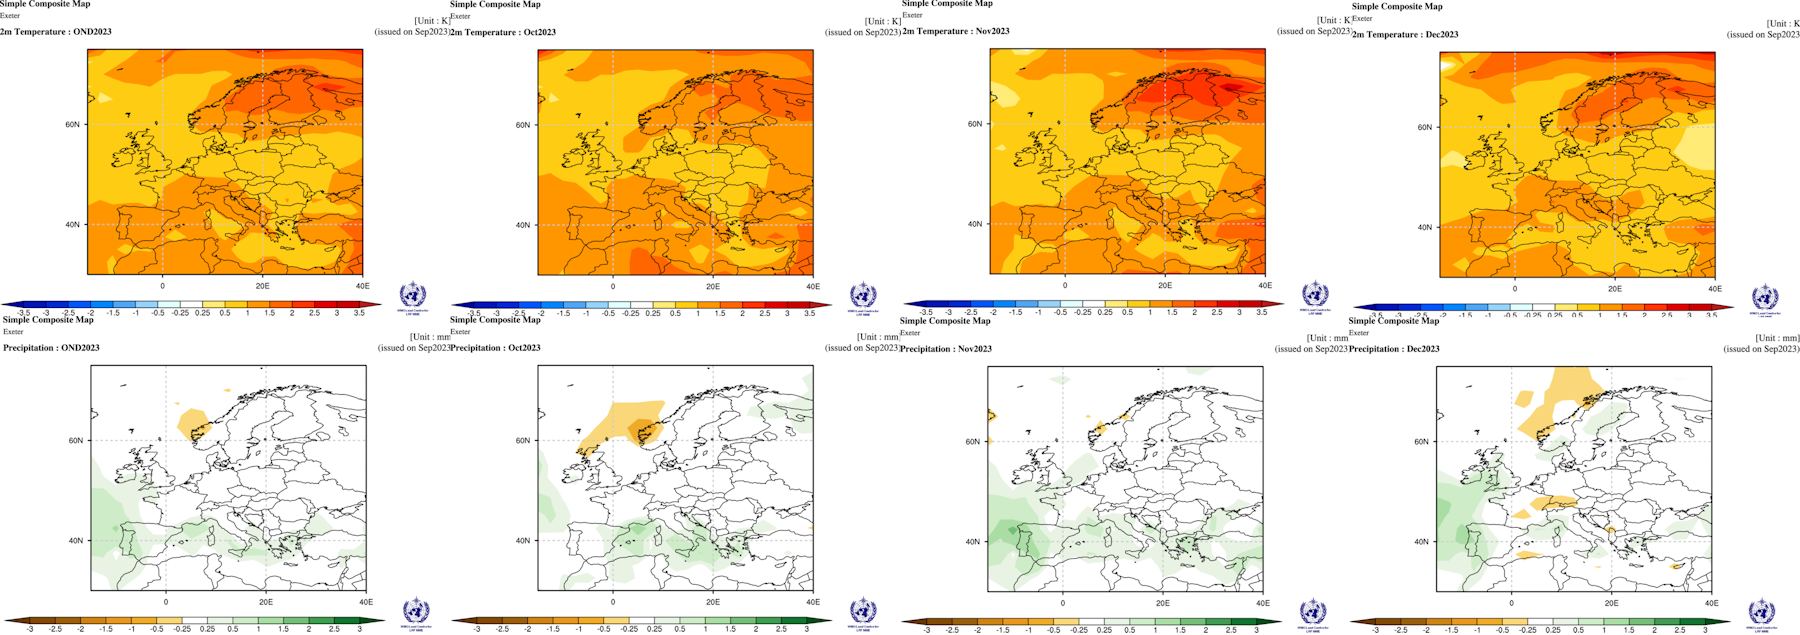
Three month average anomaly followed by May June July 2024. Top row temperature anomaly and lower row precipitation anomaly.
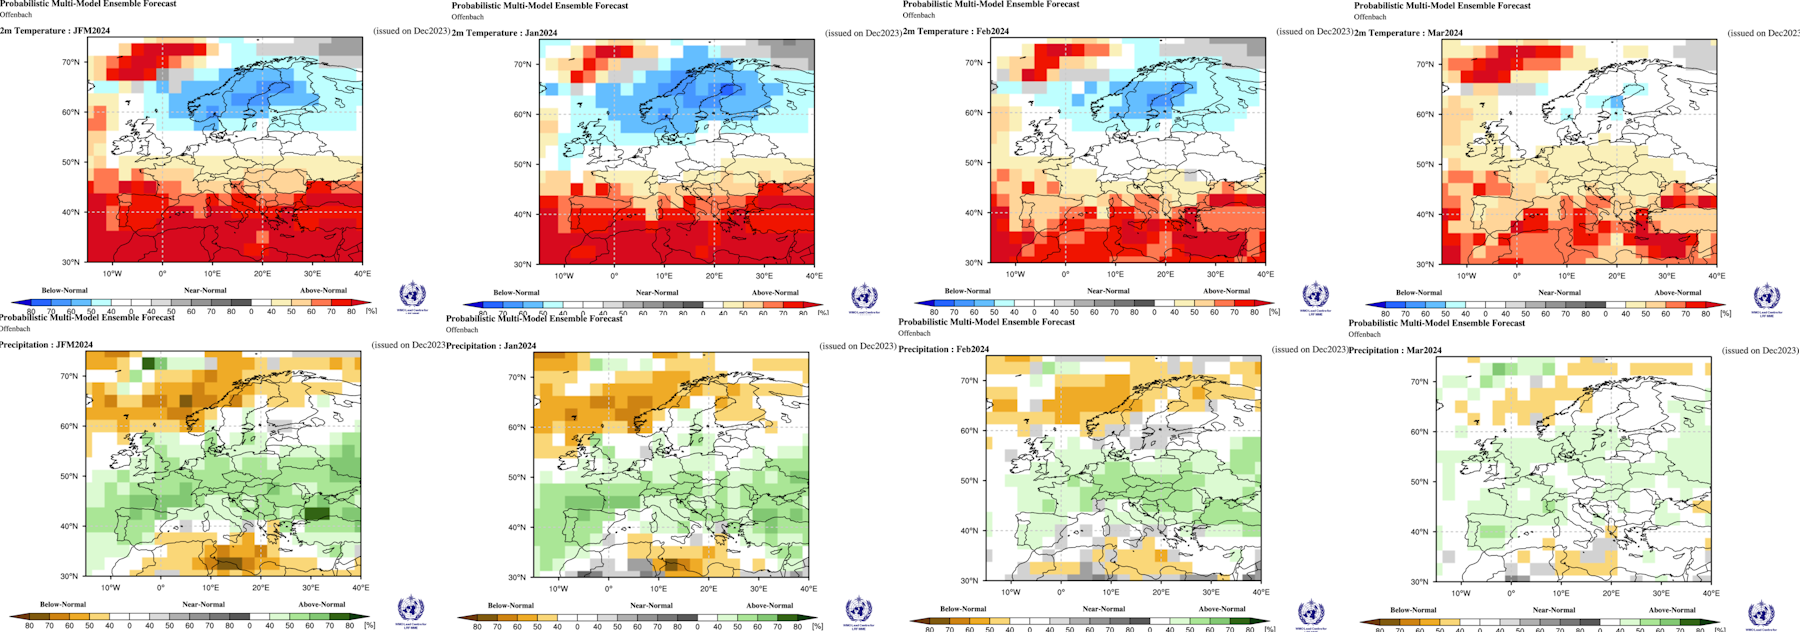
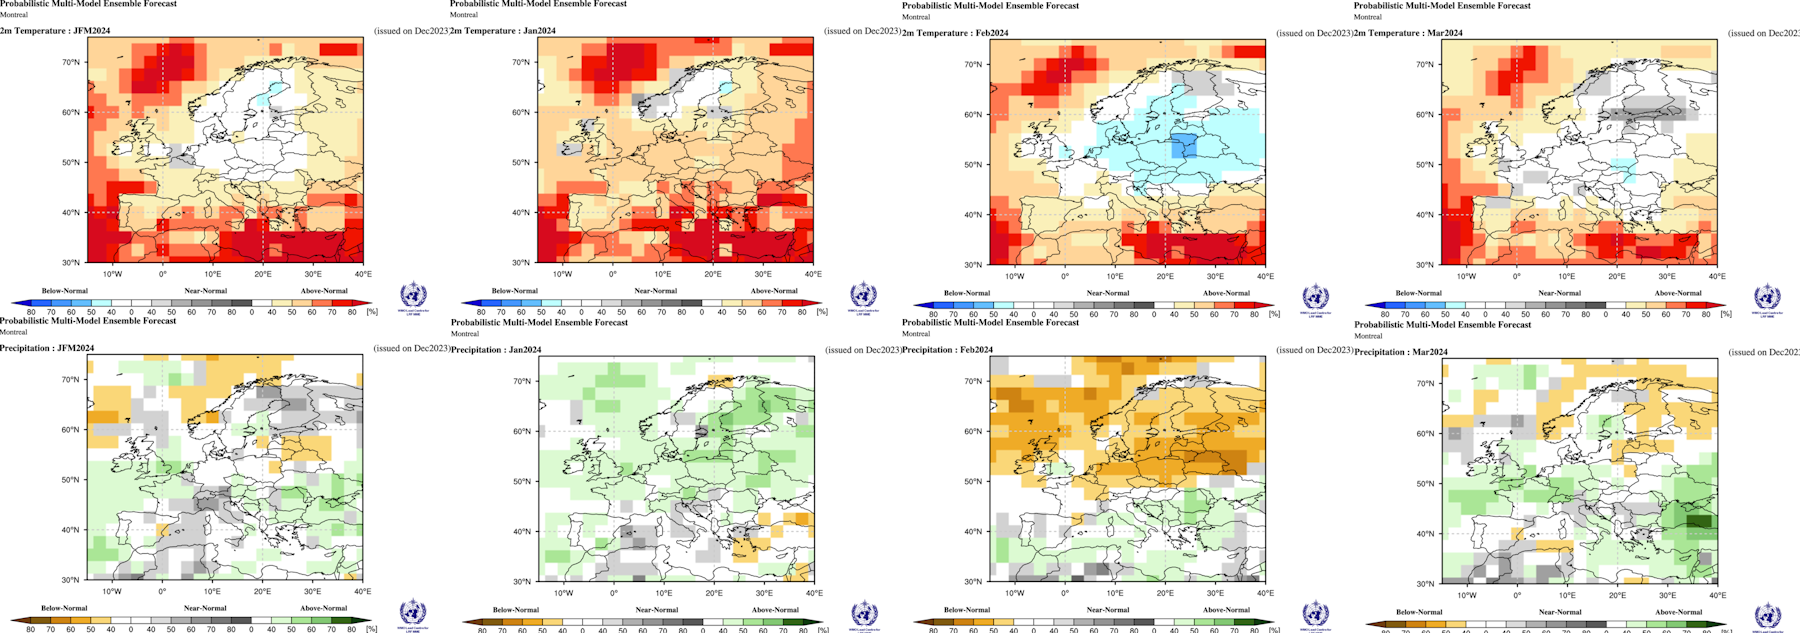
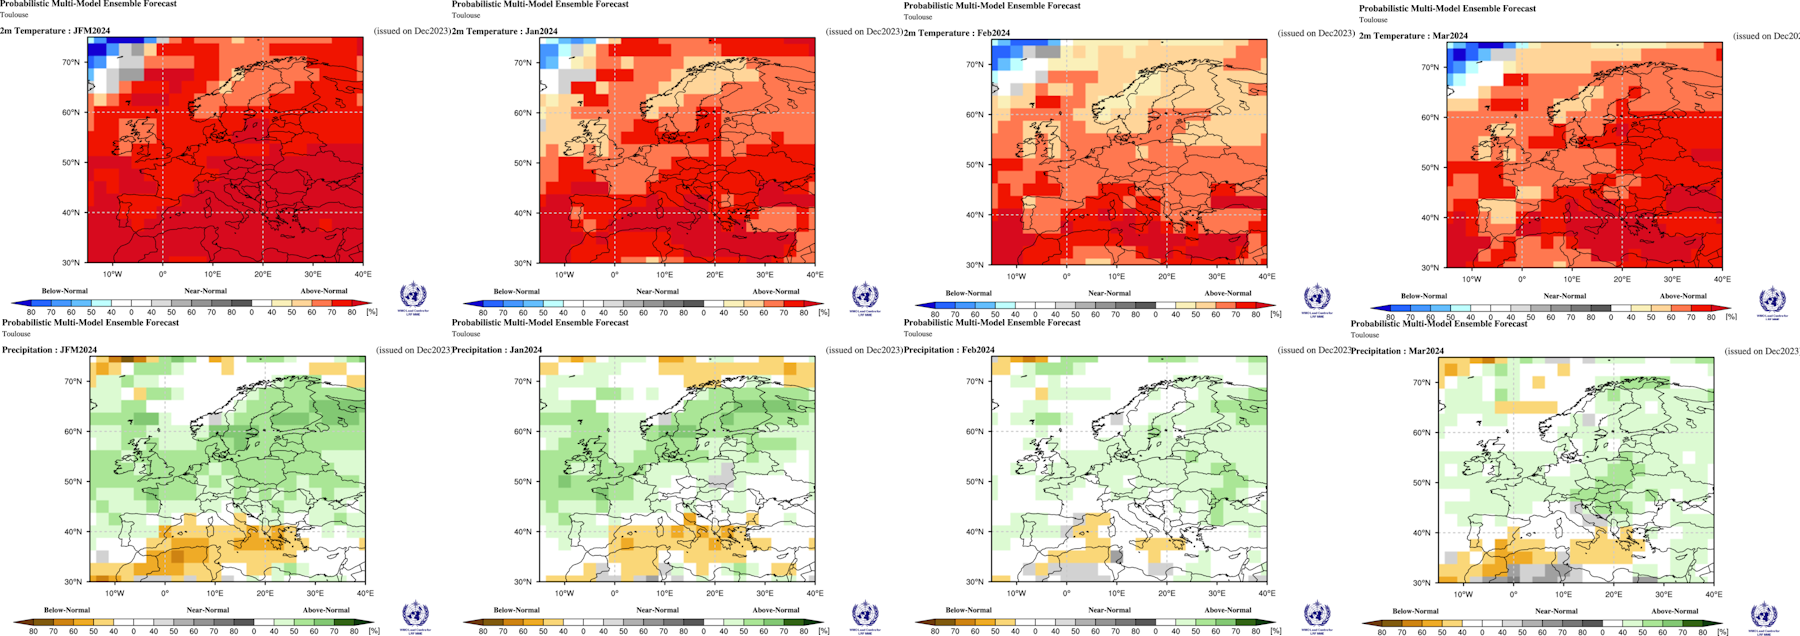
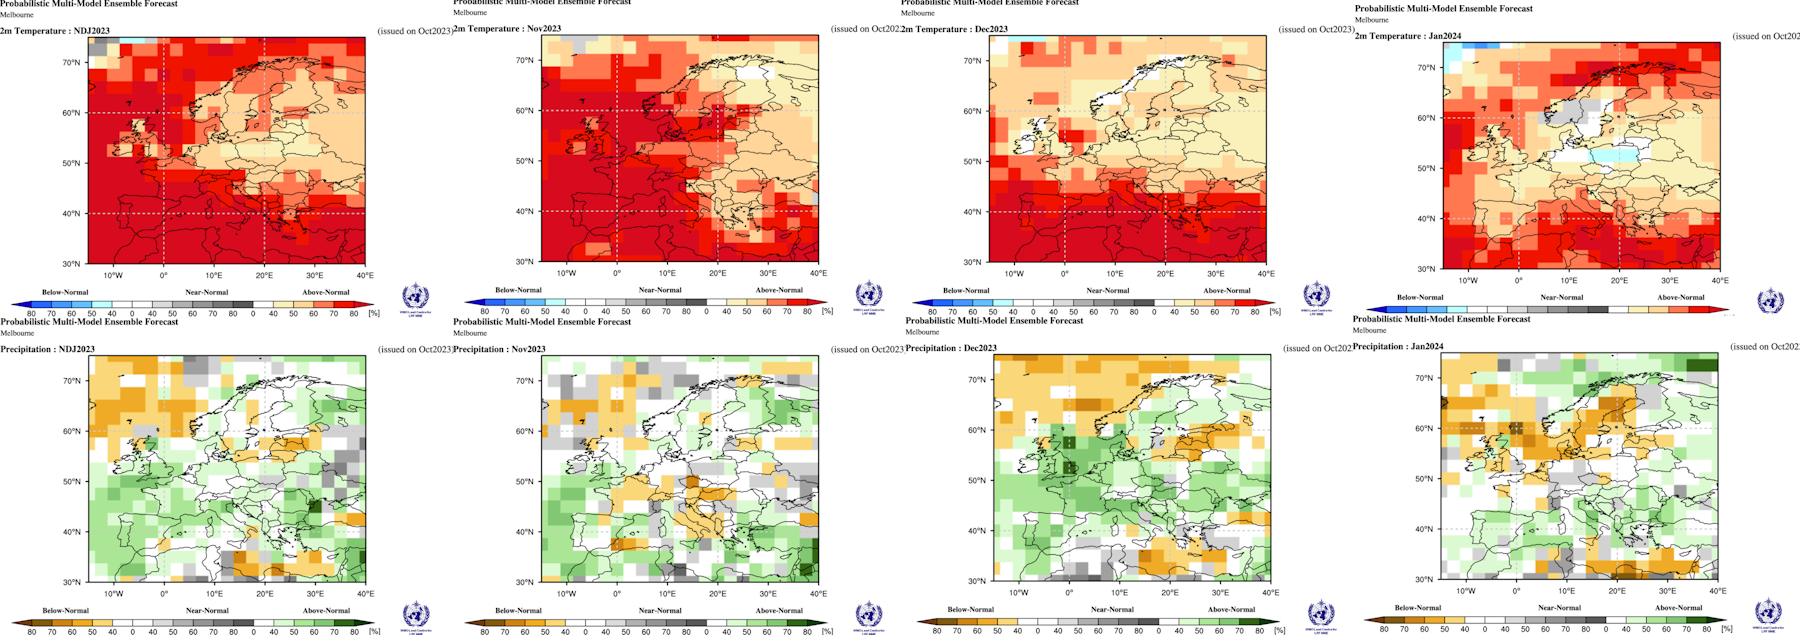
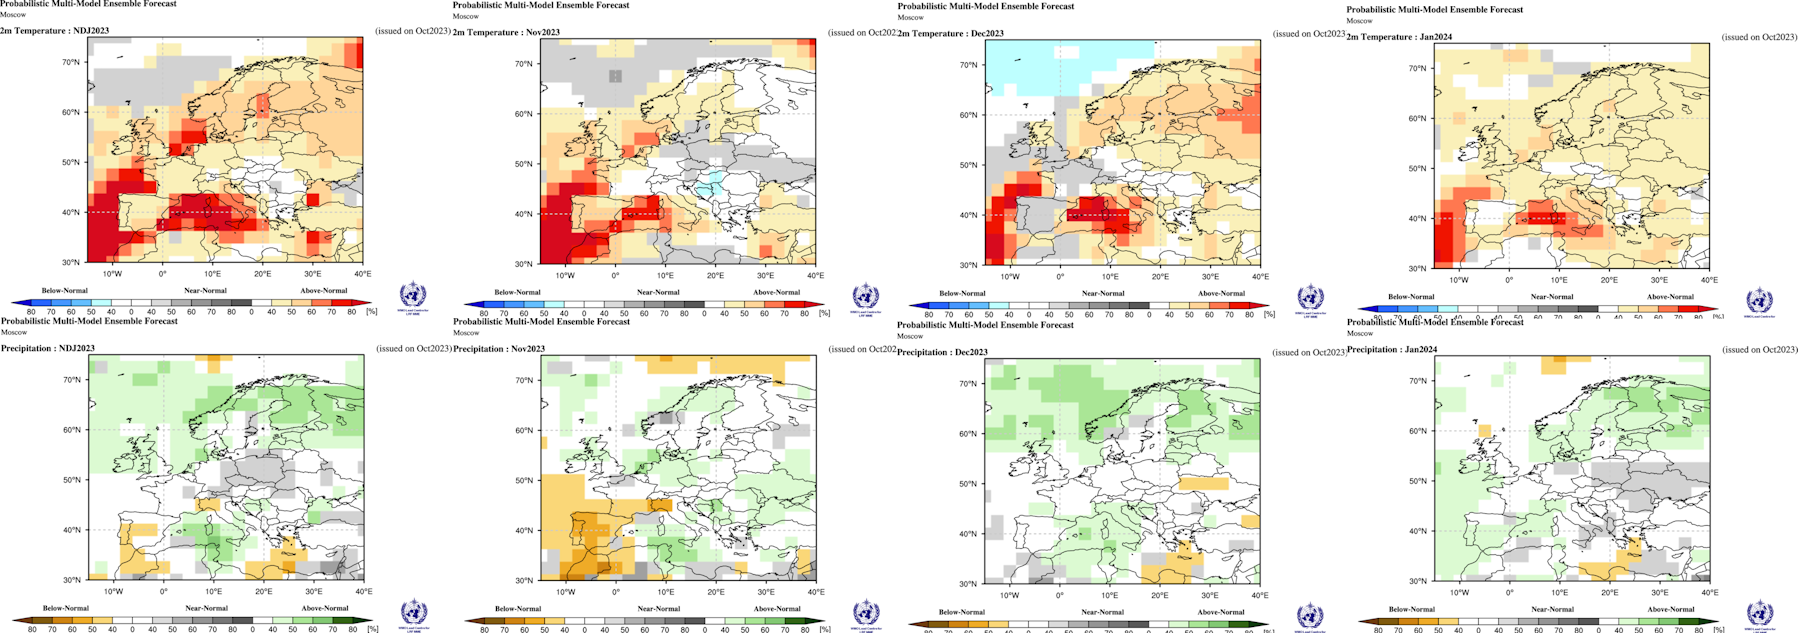
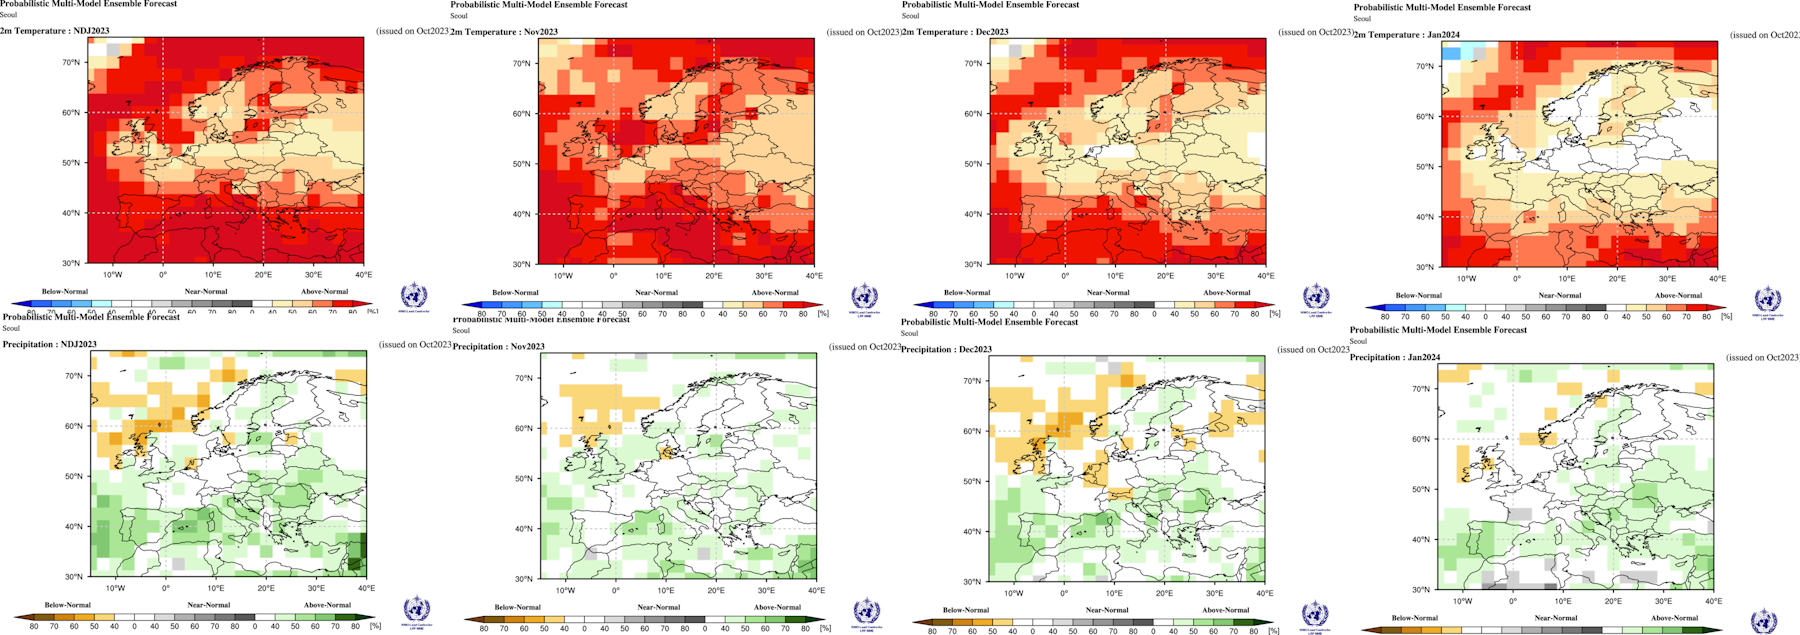
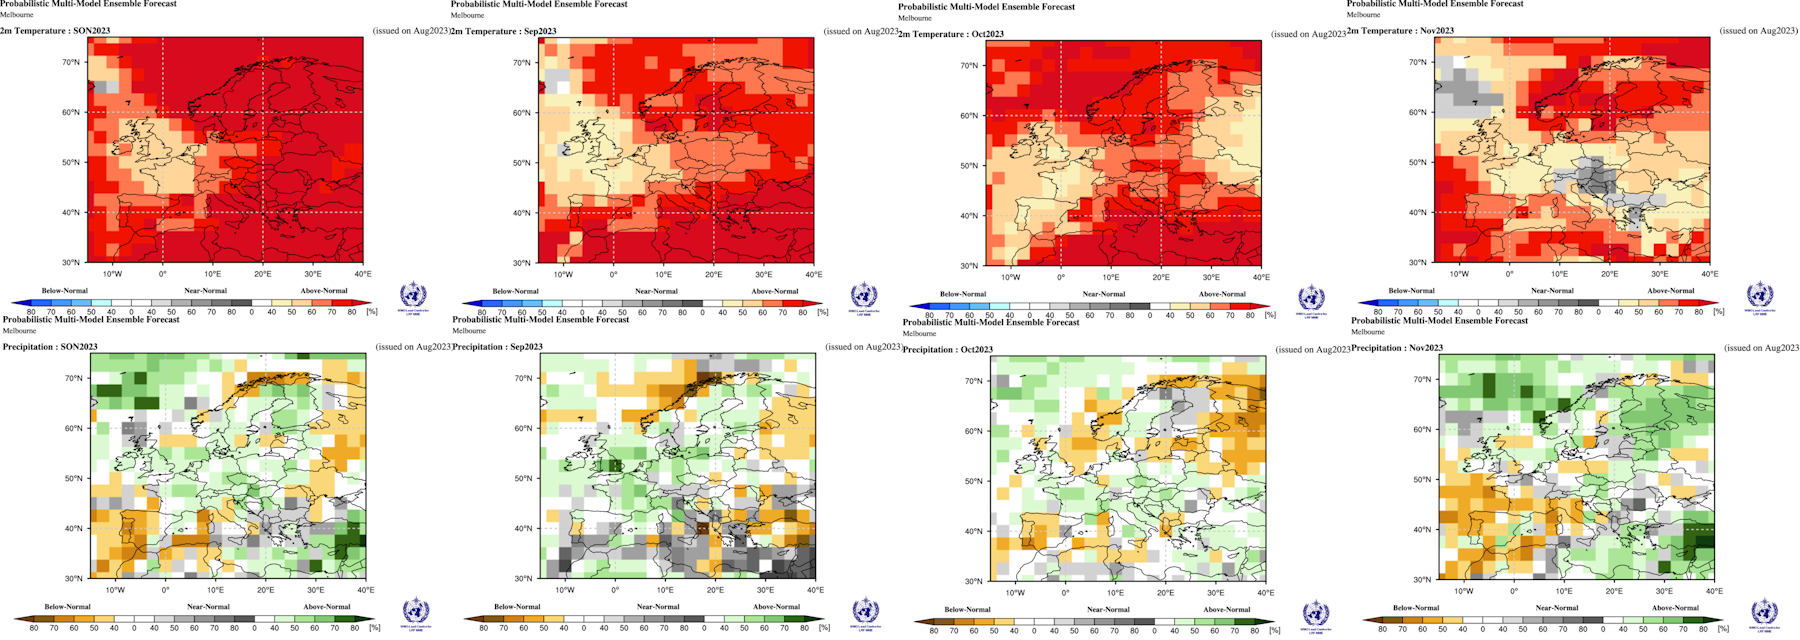
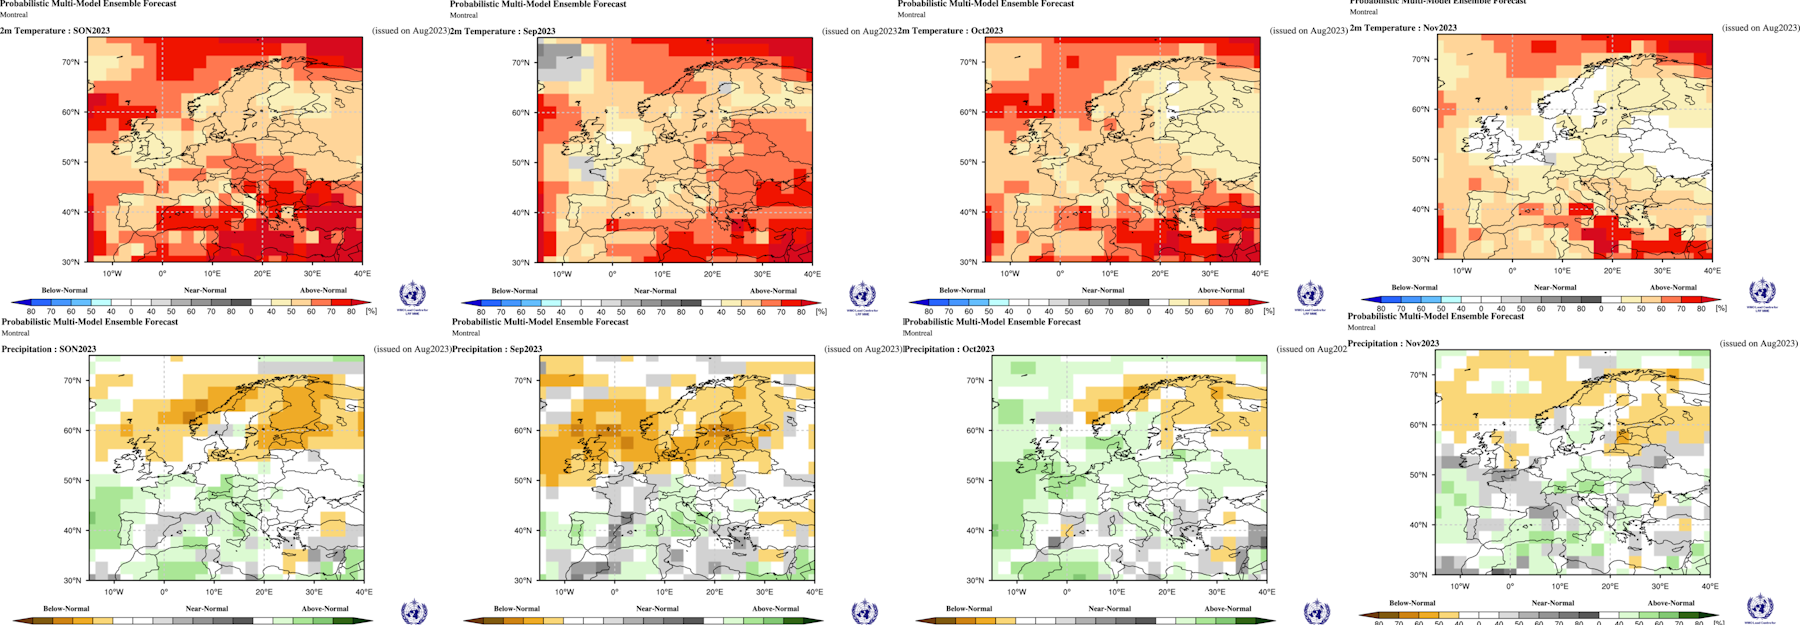
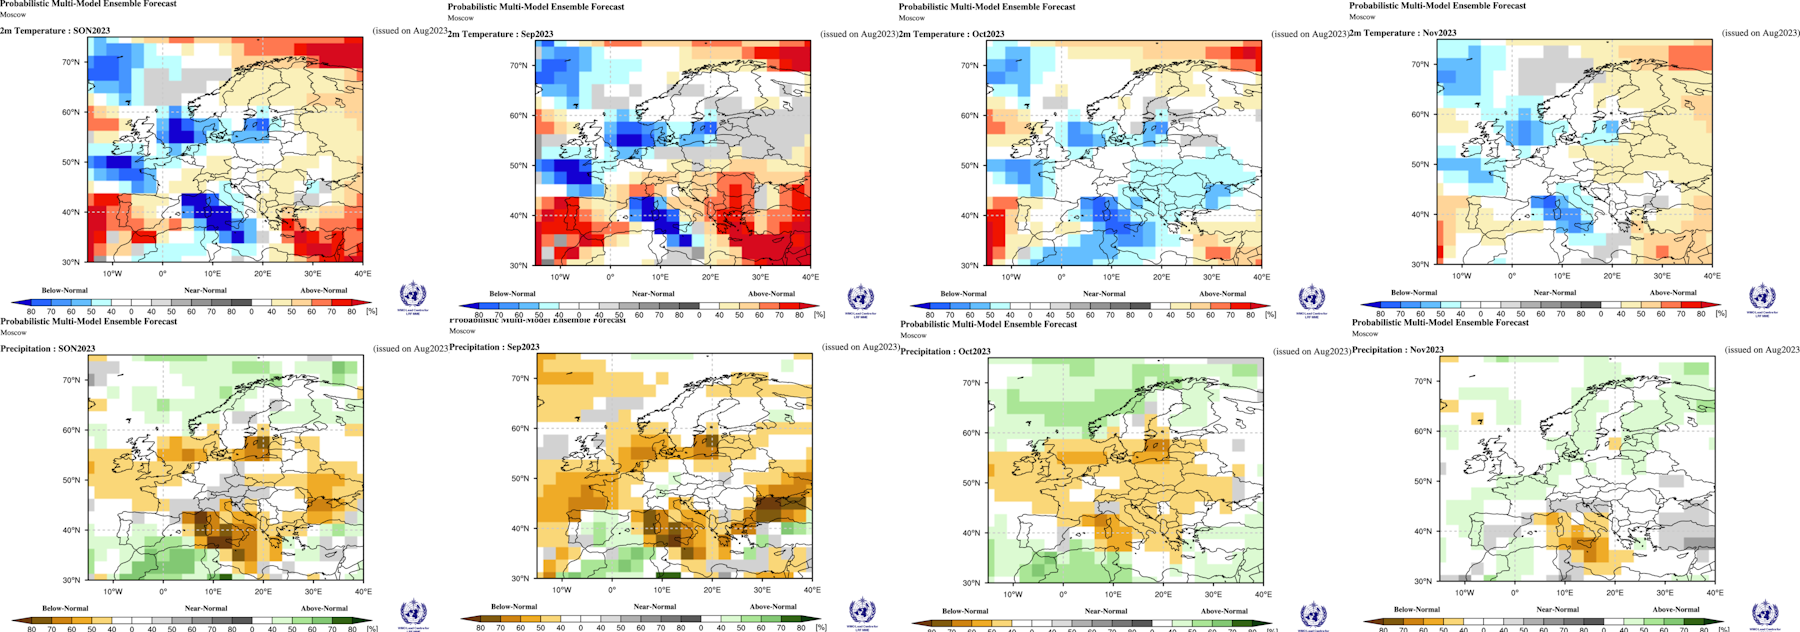
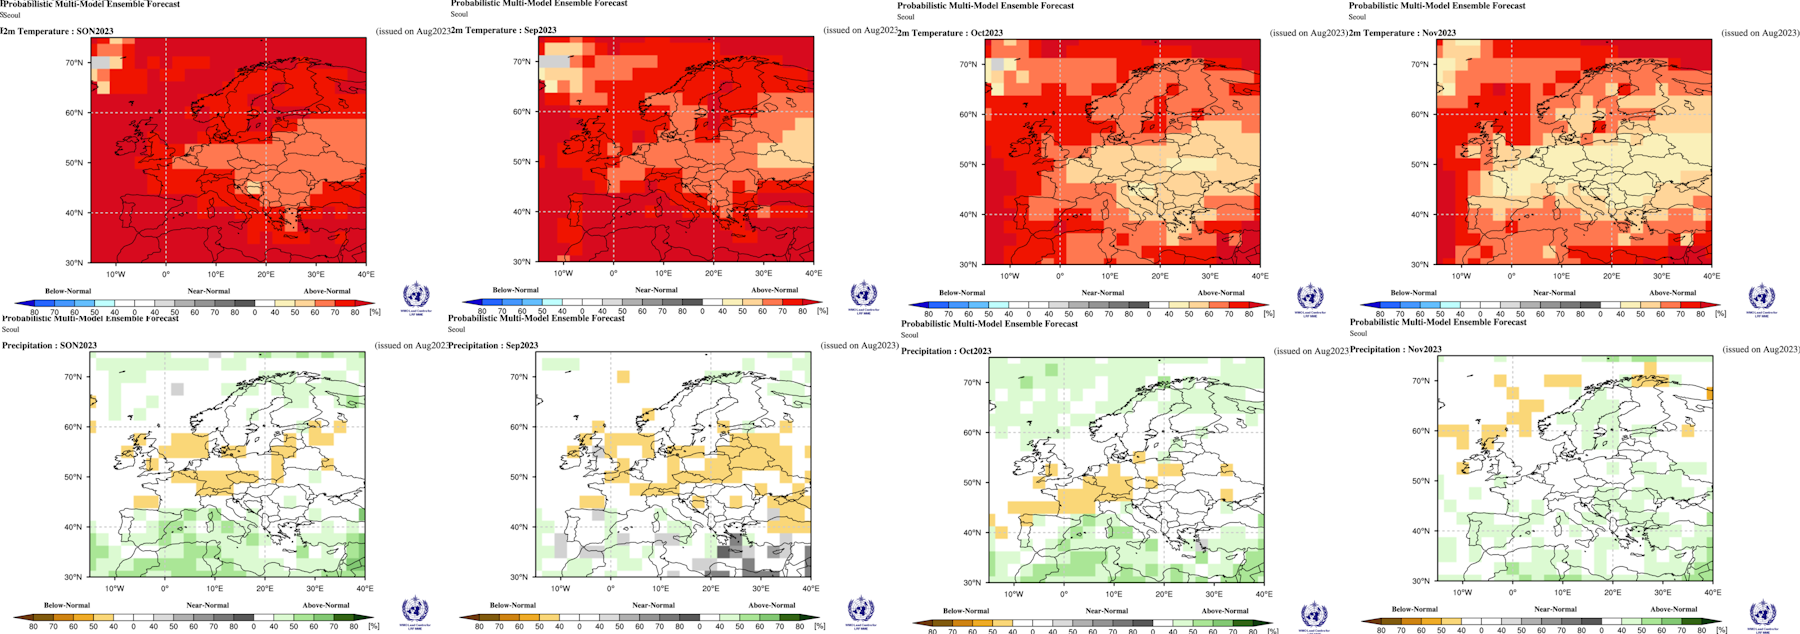
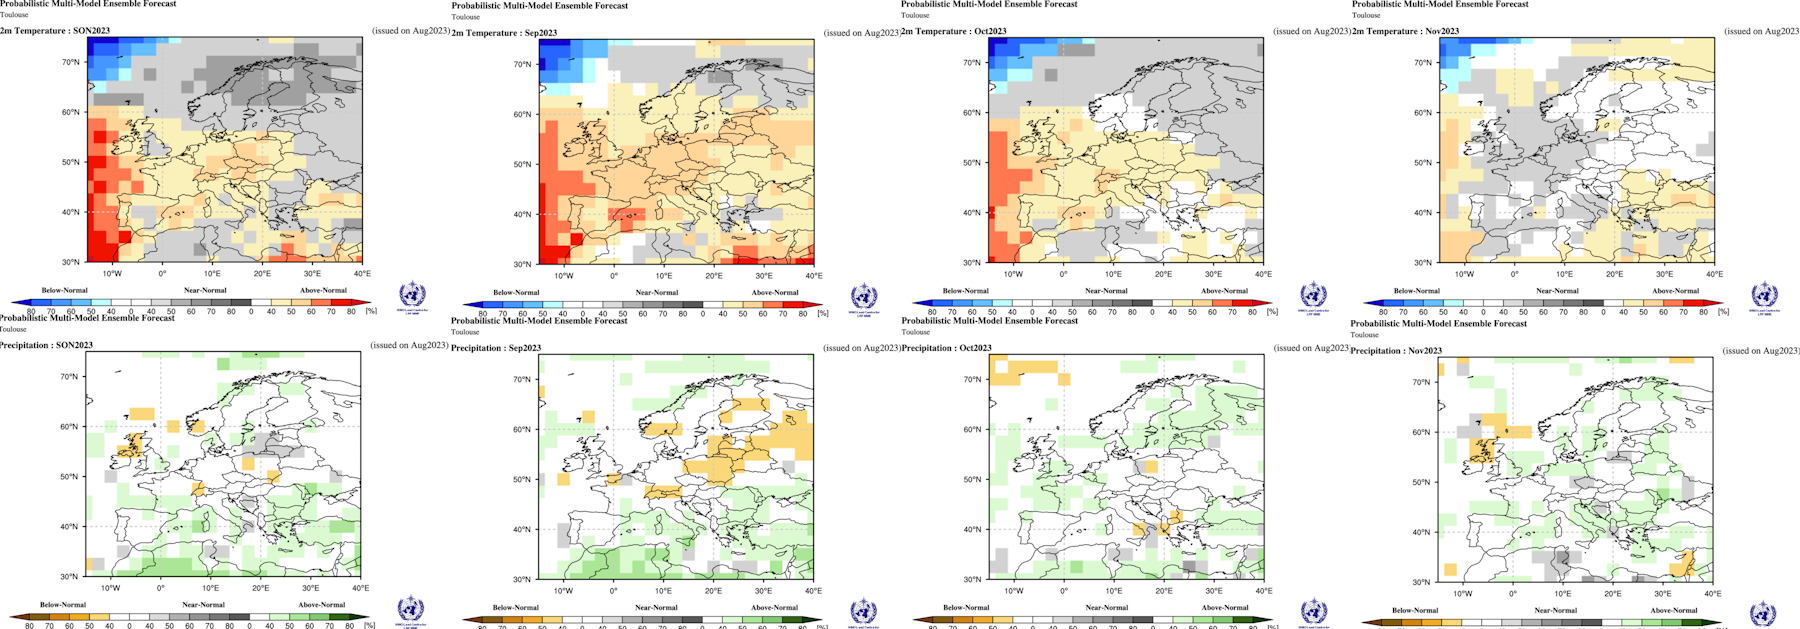
WMO super ensemble (below) is a mean of data supplied by National Meteorological organisations across the globe. Because of the amount of data the output is a low resolution.
Data shown is multi model probabilistic mean anomaly.

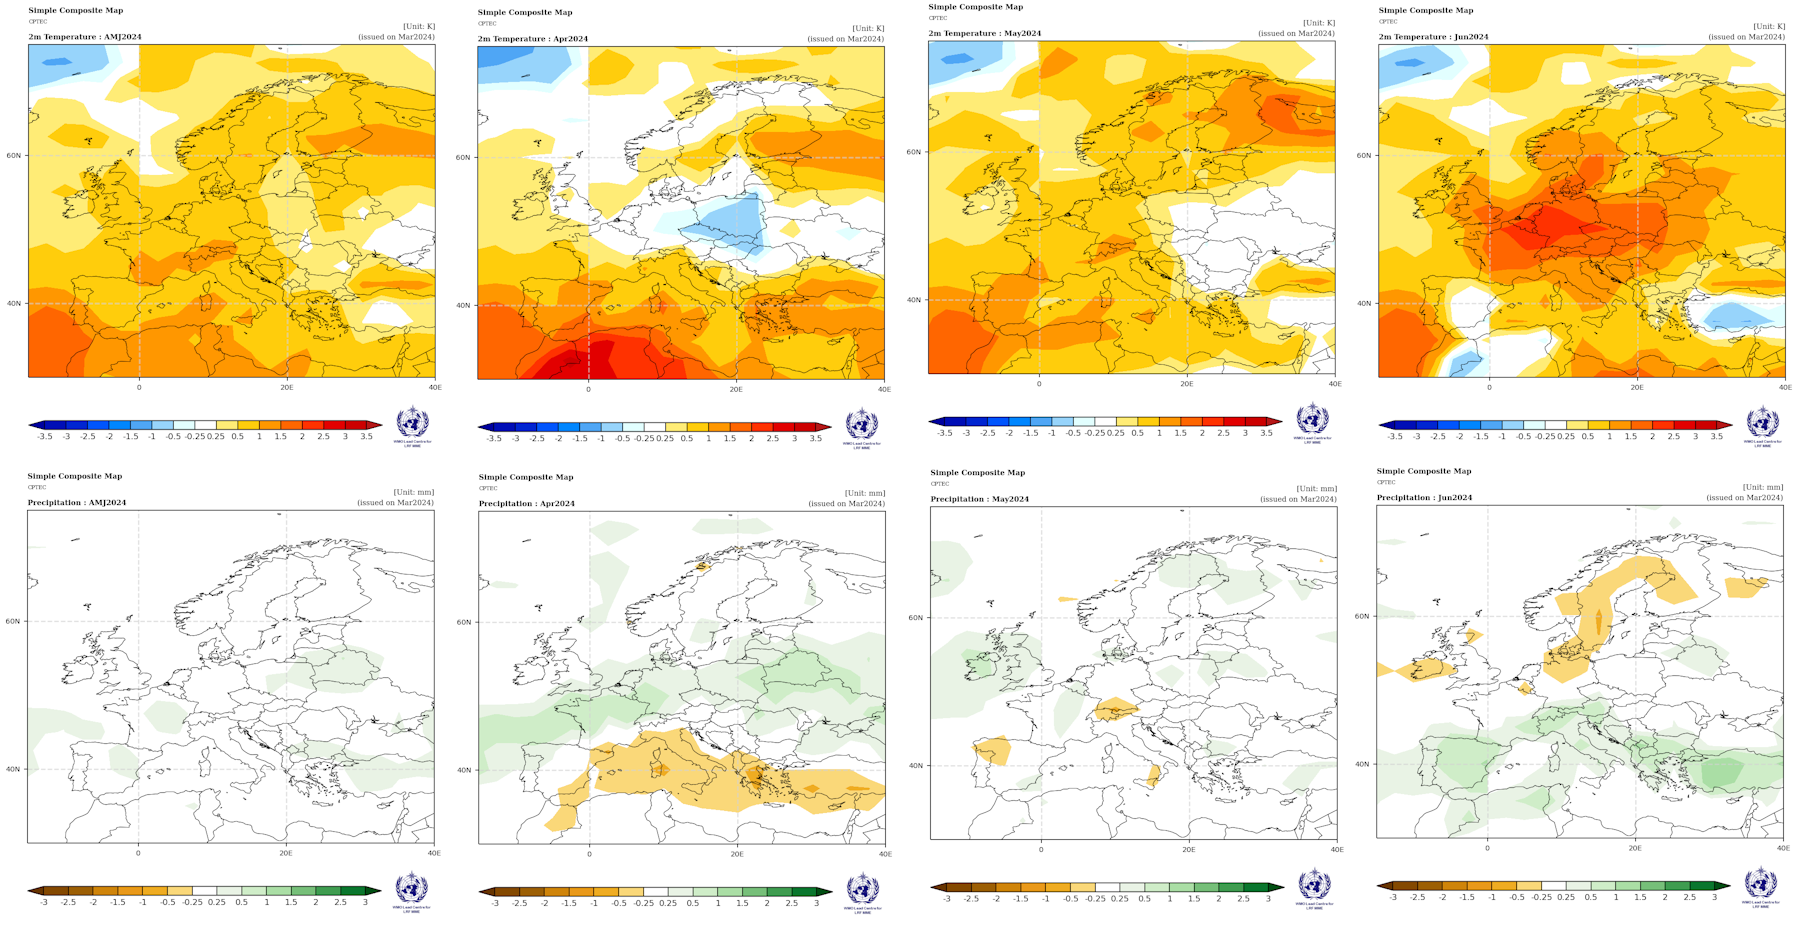
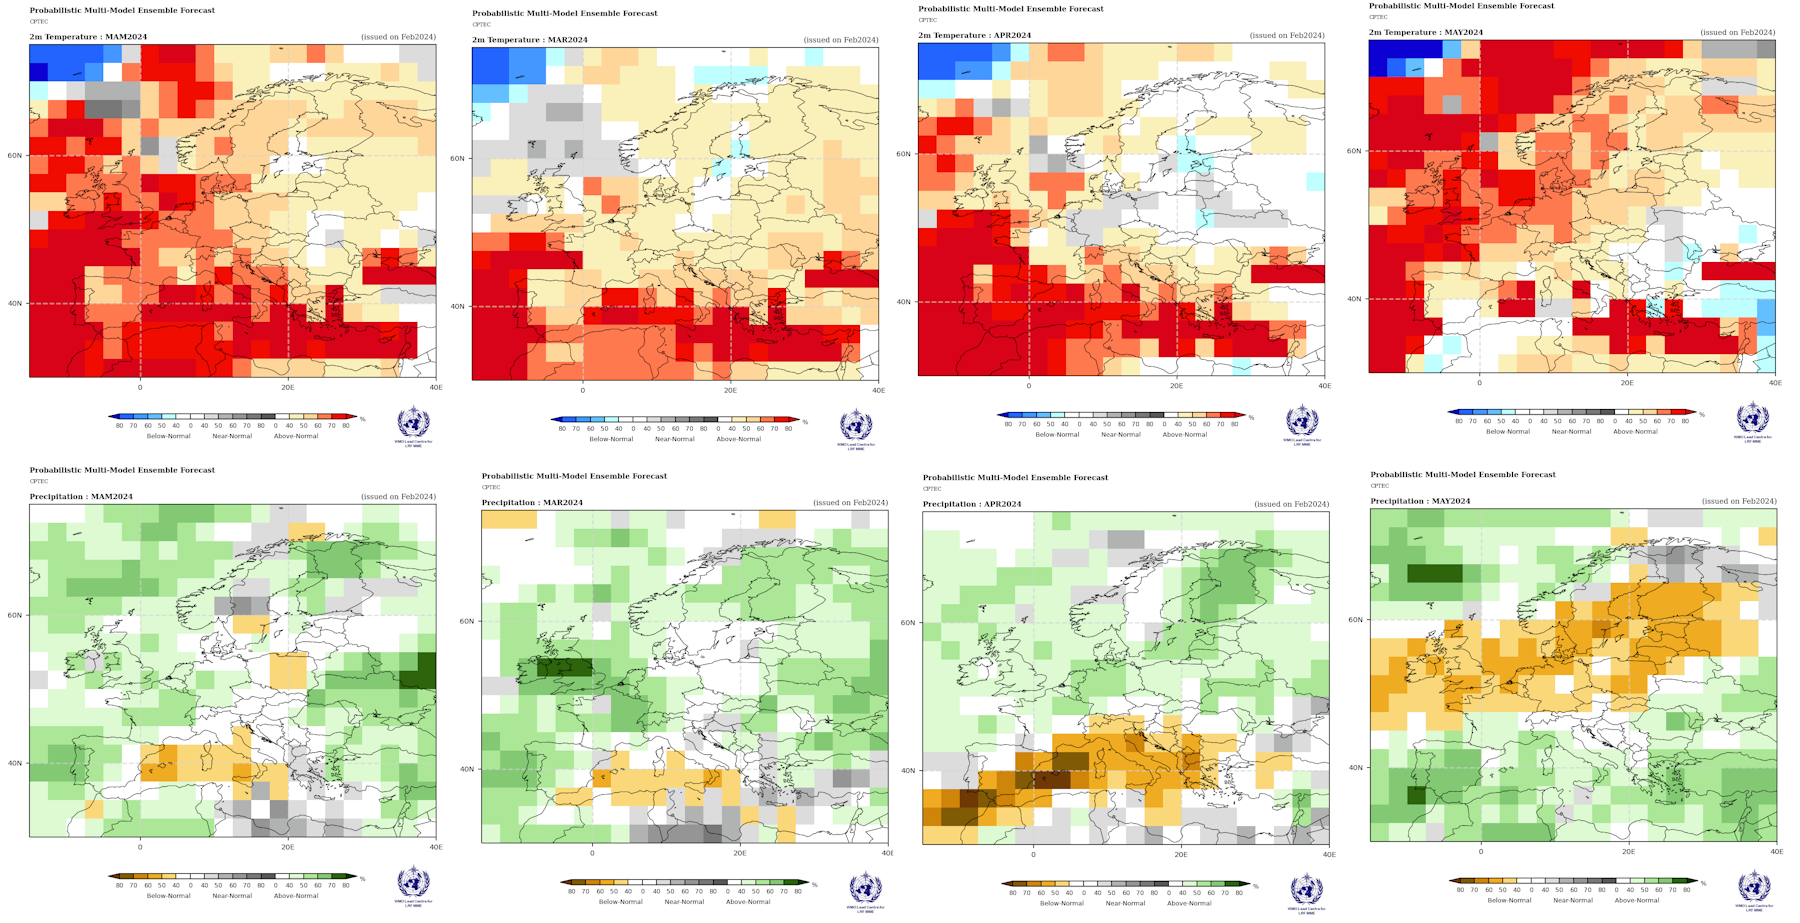
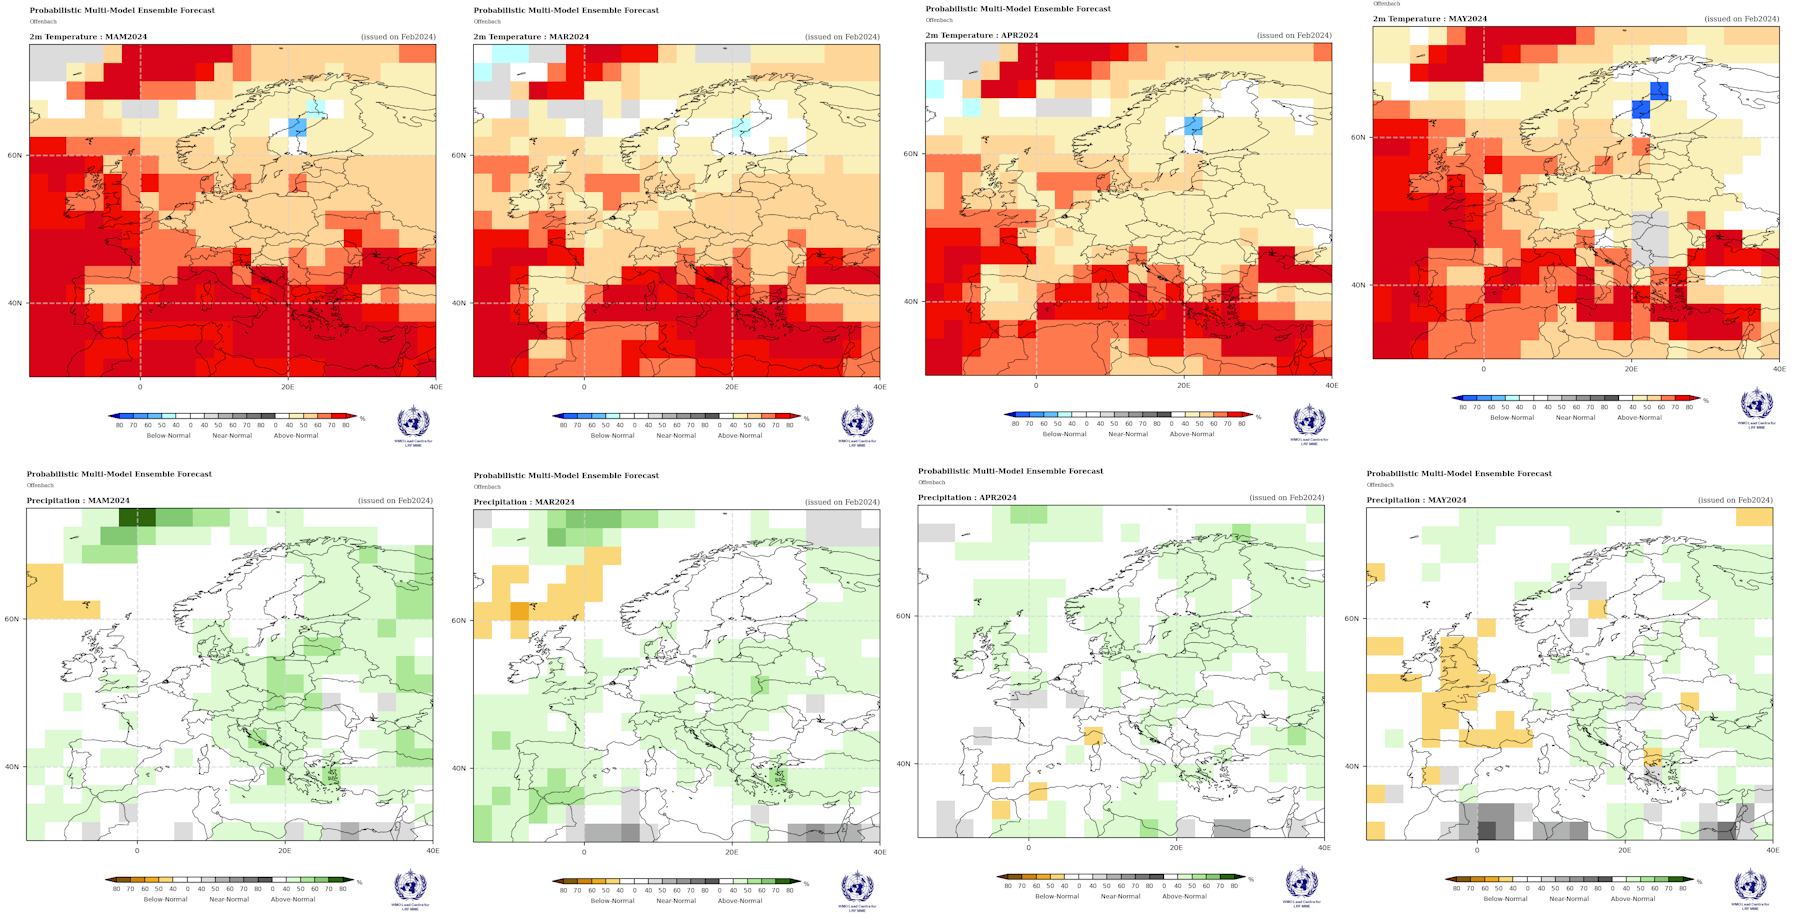
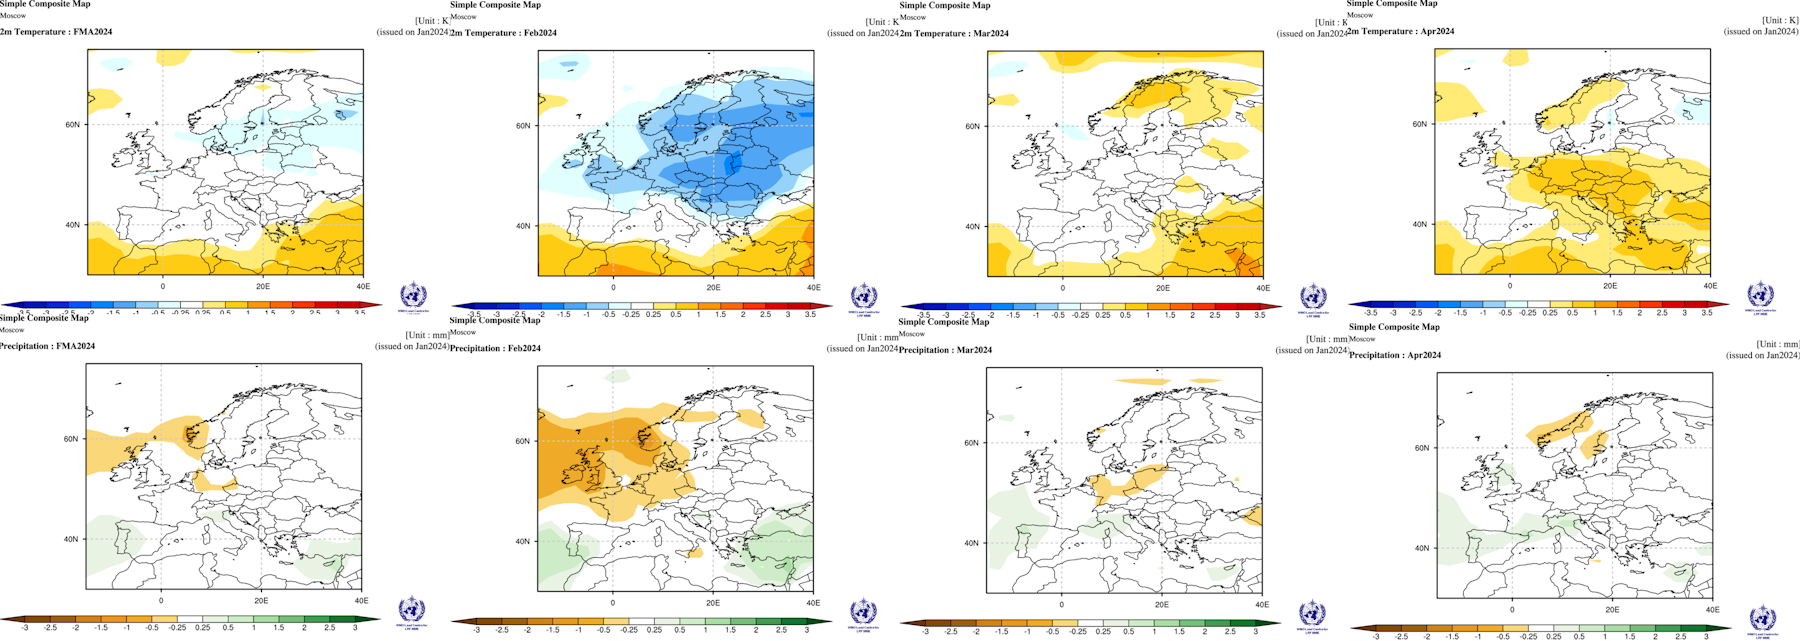
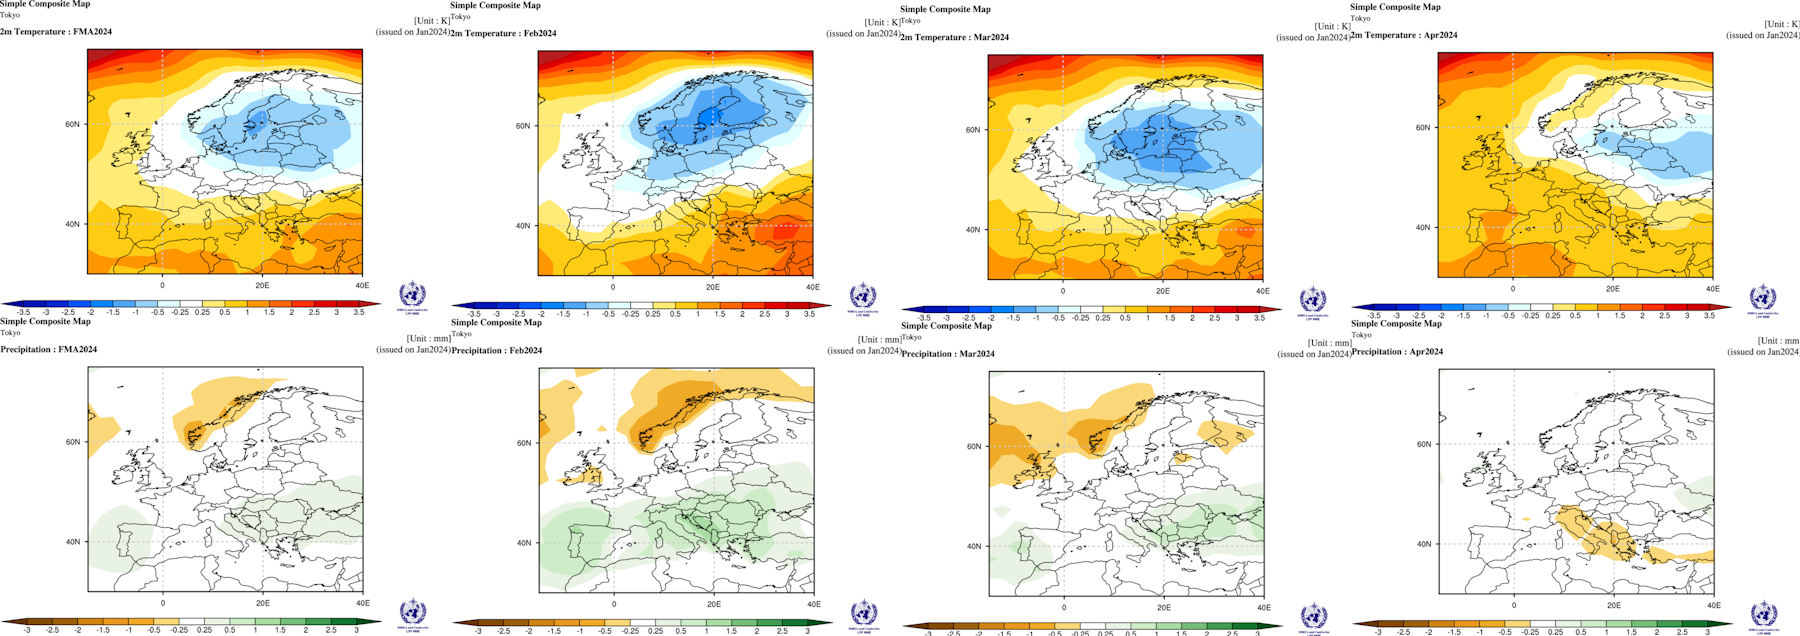
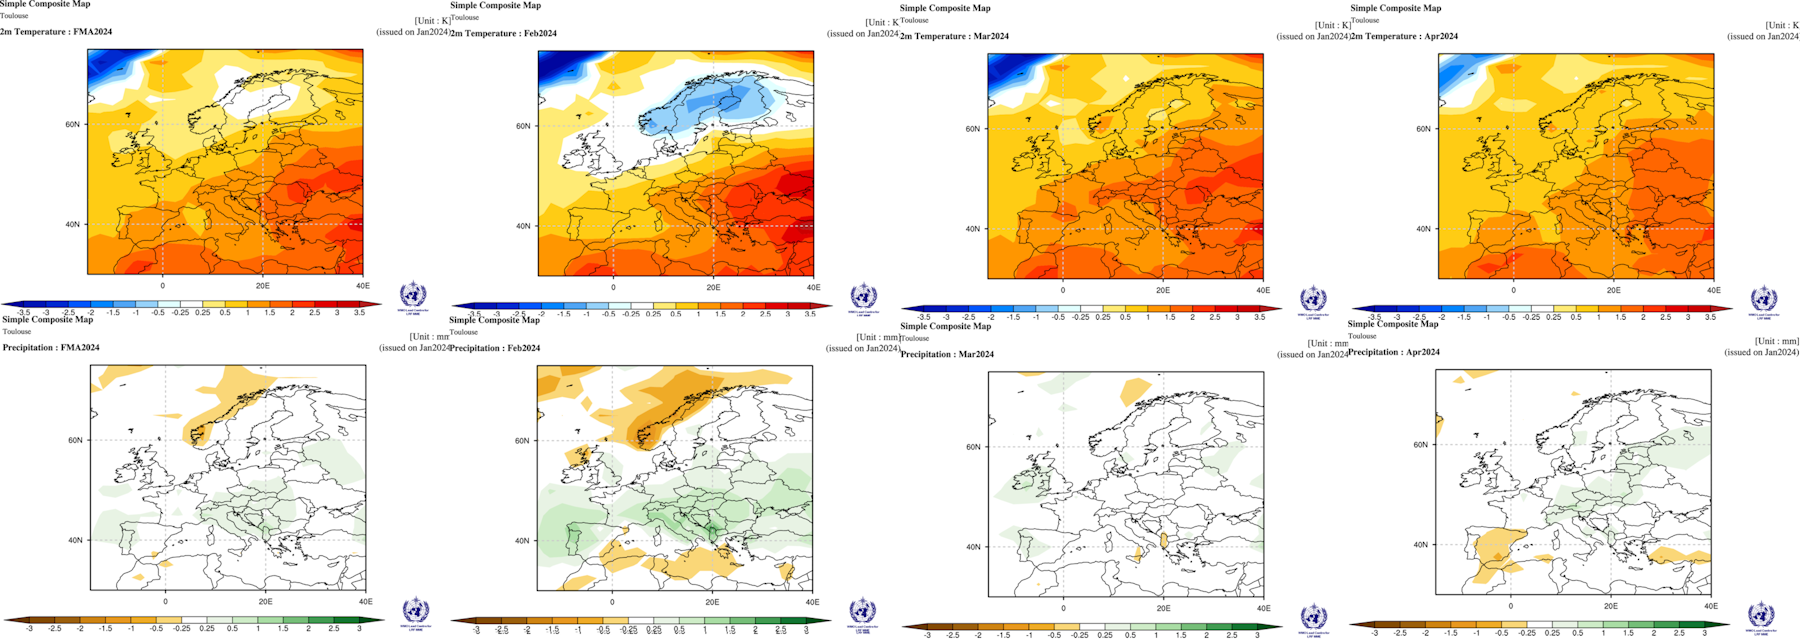
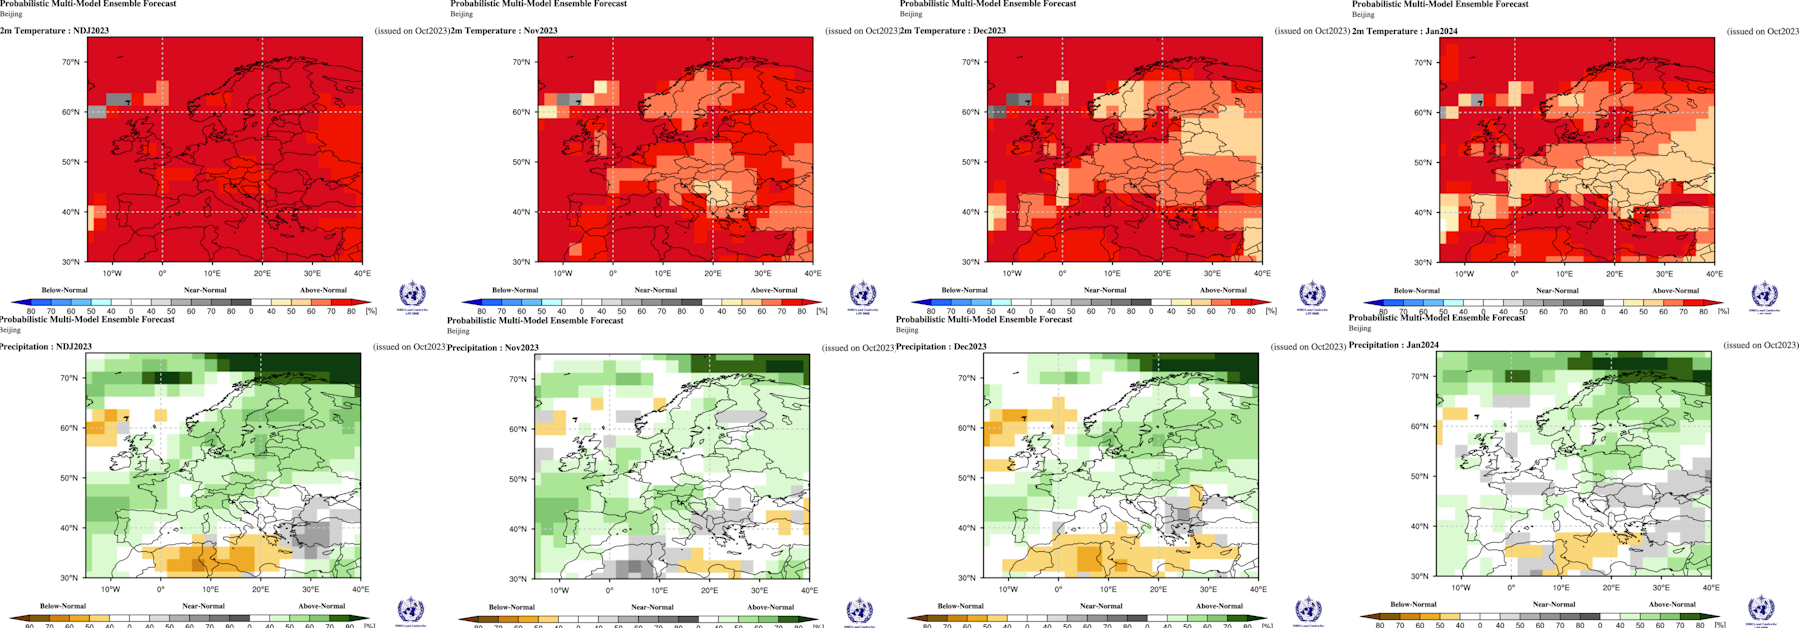
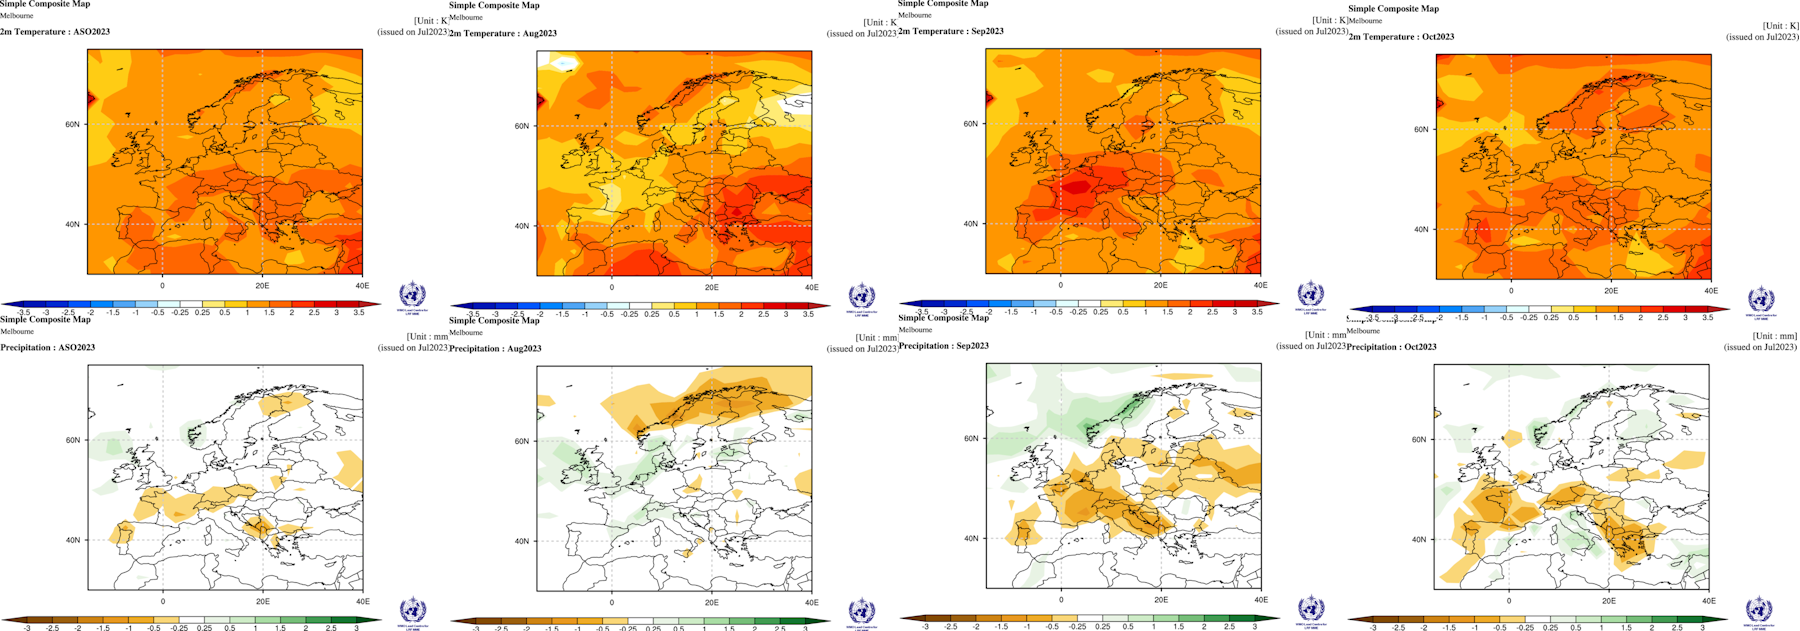
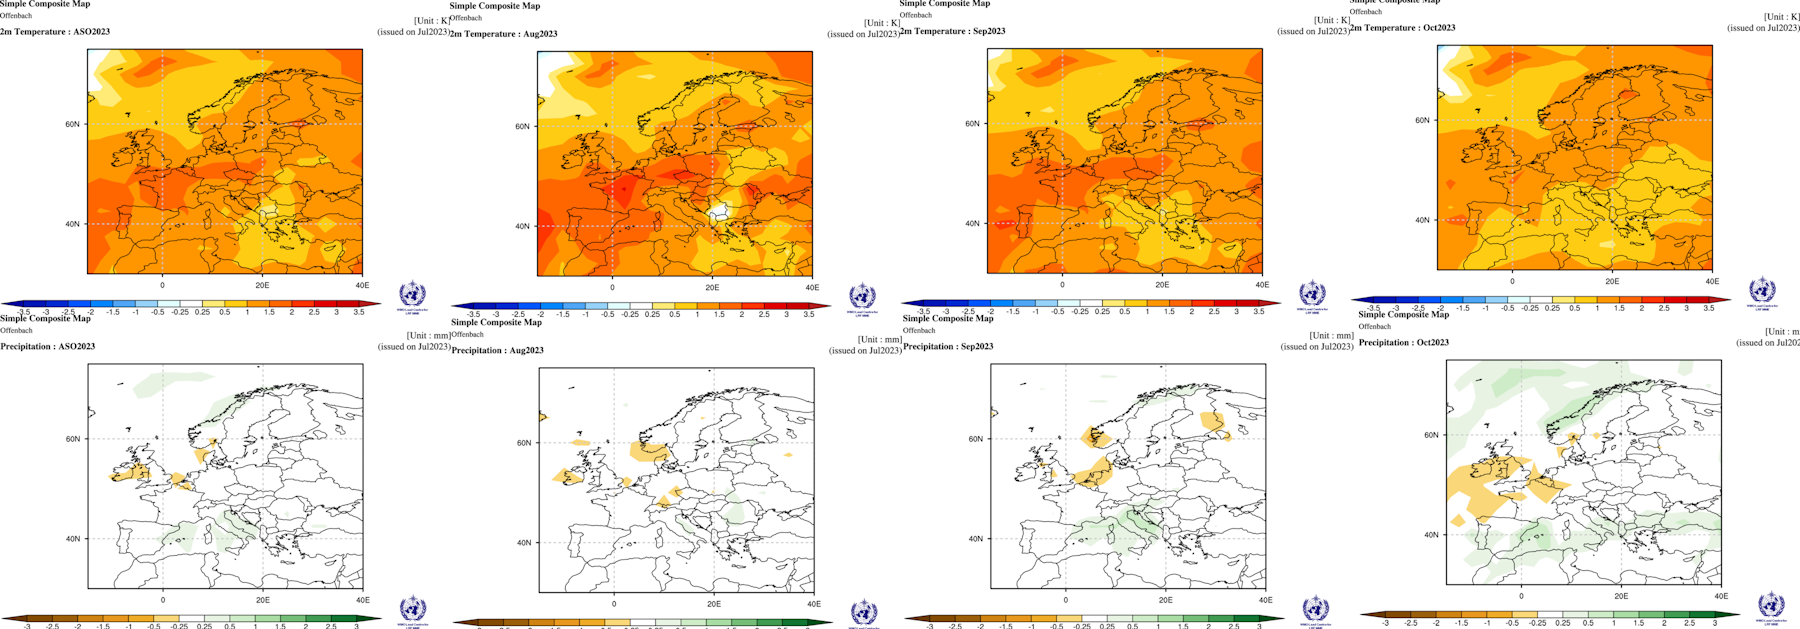
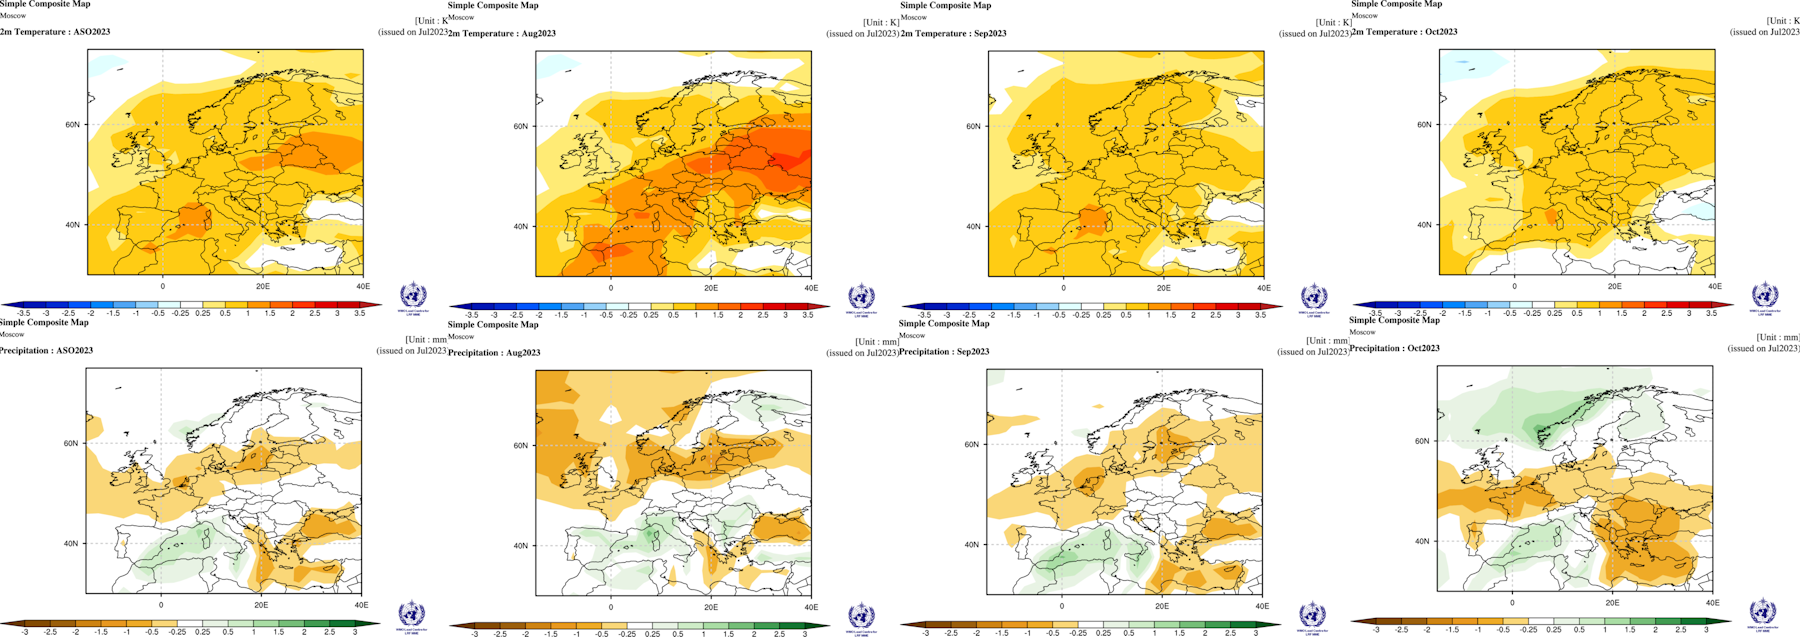
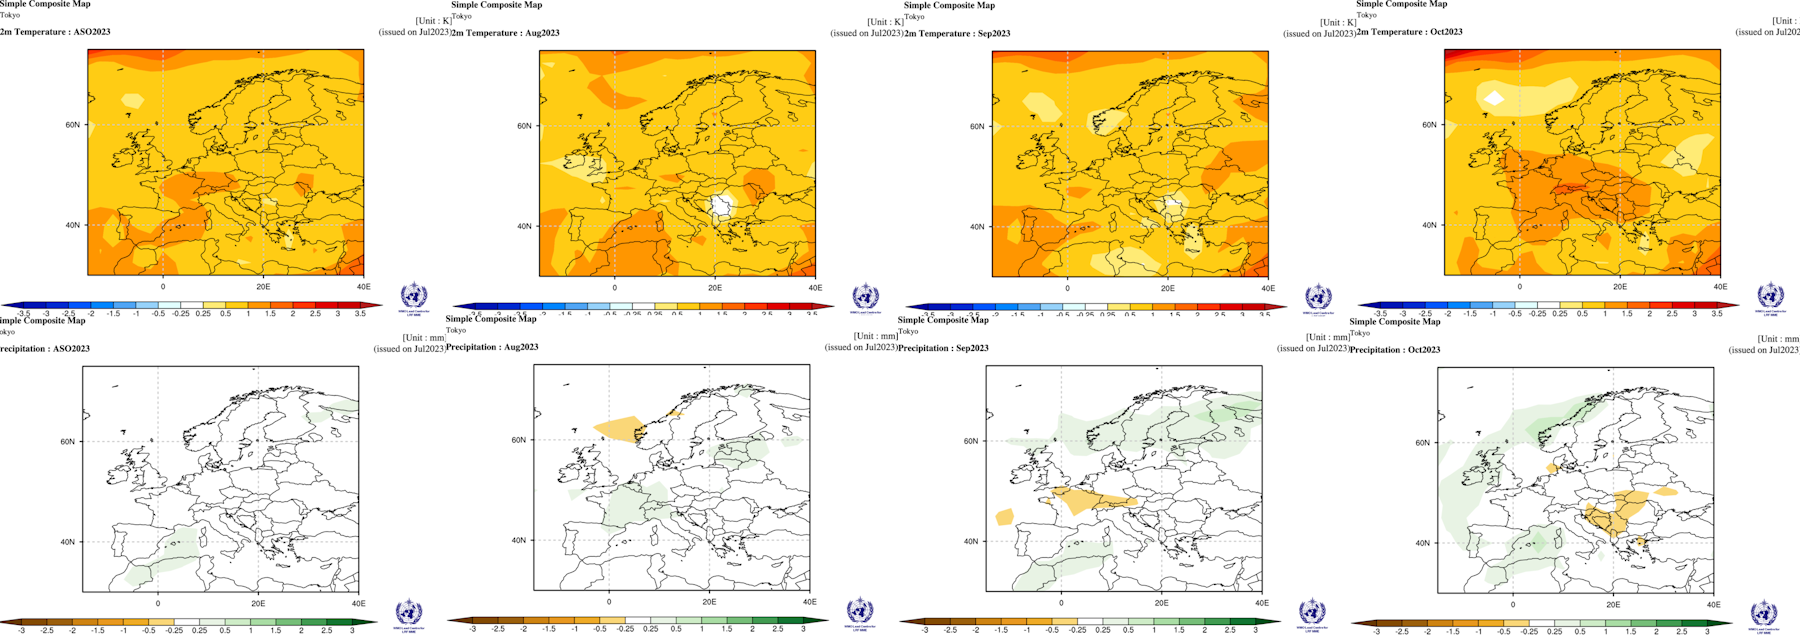
Individual members of the WMO super ensemble are shown below. (Pune India missing Pretoria looks cold).


Summer model graphics can be seen at https://www.weather-info.co.uk/wxsvc/seaslatest.html
C: Comparing previous output for UK area:
NOTE: 30 year period 1981-2010 no longer available from UKMO web site now using newer 30 year period 1991 to 2020 which has higher temperature averages. 1961-1990 shown for comparison.
Review of details looked for in seasonal forecast for January to March 2024, using December 2023 data.
Observed data
Temperature. Above normal, note January was near normal.
Rainfall. Above normal for most of England and Wales but the N and Scotland normal and probably below in NW Scotland.
Sunshine. Due to sunnier than normal January the three months may work out above average but both February and March had below average sunshine.
Pressure. Below normal overall
Original Summary – 19DEC2023 –
Temperature: For the three month period overall the temperature is expected to be above average. There are a number of models suggesting nearer or normal or even below normal for parts of the UK for February and this may well start later January and not last all of February. Even near normal would be colder than recent winters and models struggle to pick out cold spells.
Precipiation: For the three month period overall rainfall above normal, initially in the west but possible in the East during March. Chance of dier periods across N or NW Scotland later in the period. Chance of drier spells in February more widely. Snow above average for northern mountainsm below average elsewhere except in late January or February when there could be an increased snow risk for many areas compared to average.
Note 1: Large scale blocking with easterly types seem to only be reliably forecastable about two weeks ahead.
Comment: Good indication for above average temperatures but any hints at nearer normal or cooler values were misleading. Signal for wetter than average rainfall was good for the southern half of UK as was the hint at drier for NW Scotland later.
Scoring will attempt to state good, fair, poor or no signal for the 3 month period (not individual months).
Revised order
1. Russia (WMO): Temp fair. PPN good.
2. USA – CFS2 : Temp good. PPN poor.
3. UKMO Contingency: Temp fair. PPN fair.
4. UKMO : Temp good. PPN good.
5. USA – IRI : Temp fair. PPN poor.
6. KMA APCC : missing .
7. JMA : Temp good. PPN good. PMSL fair
8. NMME : Temp good. PPN poor .
9. WMO multi : Temp good. PPN good.
10. BCC : Temp good. PPN fair.
11. NASA : Temp v good. PPN mostly good .
12. CanSips : Temp fair. PPN fair.
13. Copernicus Temp good. PPN fair. PMSL fair
14. CMCC Temp good. PPN poor. PMSL poor
15: DWD Temp good. PPN fair. PMSL fair
16. EC Temp good. PPN poor. PMSL fair
17 JMA Temp good. PPN fair. PMSL poor
18 UKMO Temp good. PPN poor. PMSL poor
19. MF Temp good. PPN good. PMSL good
20 NCEP Temp good. PPN good. PMSL fair
21 ECCC Temp: fair. PPN fair. PMSL fair
WMO low res data:
BoM Temp good. PPN poor.
Can Temp fair. PPN good.
DWD Temp poor. PPN good.
KMA Temp good. PPN good.
MOSC Temp fair. PPN poor.
WASH Temp good. PPN good.
CMA Temp good. PPN fair.
ECMWF Temp good. PPN fair.
UK Temp good. PPN poor.
JMA Temp good. PPN good.
MF Temp good. PPN good.
CMCC Temp good. PPN poor.
CPTEC Temp fair. PPN good.
D: Text Forecast for SW England
Remainder of Spring 2024 (May).
Temperature is likely to be above average by around 1 degree Celsius .
Rainfall for SW England is most likely to be near normal but with a 30% chance of above normal. A drier than average May (suggested by Russia, Indian, NMME and NASA output) is roughly a 20% chance.
May climate: 1981-2010 average mean temperature 11 or 12°C. Average May rainfall roughly 70mm but 150mm over moors and 40mm in drier East of region.
Summer 2024 (June July August) limited data.
Temperature expected to mean about 1 or 2 degrees Celsius above climatology. Rainfall totals likely to be near average, although there are again hints at longer drier spells in July and/or August. Very localised thunderstorms can increase the rain totals so perhaps a below average number of rain days might be a better indication than the rainfall total.
Summer climate: 1981 to 2010 average daily mean temperature 14 or 15°C in many areas to 16 or 17°C in main urban areas also locally east of the moors and more widely in Somerset. Maximum temperatures average 19 to over 21°C in similar areas. July often warmer than August. Average 1981 to 2010 rain 300mm over the moors, typically 200 to 250mm in many coastal and eastern areas. June often drier than July and July drier than August.
Autumn 2024 (September October November) limited data
Milder/warmer than average. The start of Autumn could be wetter than average but the second half drier..
Autumn climate: 1981 to 2010 average mean temperature 11 or 12°C but nearer 10°C in rural areas. Maximum temperatures average 14 to 16°C. November normally colder than October which is colder than September. Average 1981 to 2010 rain 300 to 400mm, 600 to 800mm over the moors but east of the moors and in lowland Somerset more like 200 to 300mm. September often drier than October or November.
Winter (December 2024 January and February 2025) minimal data
Milder than normal winter overall although January and February may be nearer average. Precipitation above average for the season but with a chance of nearer normal values in January and February. Snow probably near average so perhaps some days with snow accumulation at low levels.
Winter Climate: 1981-2010 average temperature values for lowland areas 7°C in the West and 5°C in the East. Rainfall; Dec and Jan typically wetter than February. 1981-2010 Autumn average 300-400 mm lowlands but 200-300 mm areas to E of Dartmoor. Snow climatology less than 5 days lying snow over lowland areas, 5 to 10 days over hills around or above 200 metre elevation – one in three years have no lying snow on low ground.
E: Caution.
Experimental Long Range Forecasts do not have a good success rate, especially with regards to precipitation. The models are good at predicting above average values but not for picking out a one off colder month. The data used for the above forecast summary can be seen at here.
The attempt at a Regional Forecast for SW England aims to test whether such a forecast of temperature and rainfall variation from average can be made using numerical model data available on the internet. The forecast should not be used for any other purpose. A brief verification summary for the UK and Eire is routinely published at http://www.weather-info.co.uk/wxsvc/Verification.html or Click here for the Teignmouth and Dawlish summary
F: References.
SST anomaly NOAA Remote Sens. 2014, 6(11), 11579-11606; doi:10.3390/rs61111579
IRI statistics: Mason, S.J. and L. Goddard, 2001: Probabilistic precipitation anomalies associated with ENSO. Bull. Amer. Meteor. Soc., 82, 619-638.
UK climate details see: http://www.metoffice.gov.uk/public/weather/climate/
NMME information: http://journals.ametsoc.org/doi/abs/10.1175/BAMS-D-12-00050.1
CFS2 info
GLOFAS Acknowledgement: Data were provided by the Global Flood Awareness System – GloFAS (http://www.globalfloods.eu/) of the European Commission Joint Research Centre and the European Centre for Medium-Range Weather Forecasts.
Reference: Alfieri, L., Burek, P., Dutra, E., Krzeminski, B., Muraro, D., Thielen, J., and Pappenberger, F.: GloFAS – global ensemble streamflow forecasting and flood early warning, Hydrol. Earth Syst. Sci., 17, 1161-1175, doi:10.5194/hess-17-1161-2013, 2013.
‘Copernicus Products’ as listed in the C3S or CAMS Service Product Specification or any other items available through an ECMWF Copernicus http://climate.copernicus.eu
International seasonal monthly data from WMO
Climate data from The Met Office UK and NCEP USA
Contains public sector information licensed under the Open Government Licence v3.0.