Published 19 November 2022.
GDPR statement: Please note that the author of this blog does not set cookies but the host “wordpress.com” sets multiple cookies which are outside of the authors control. You can view their cookie policy here.
A: Overview
1. Influences.
Changes in sea temperature

Sea temperature anomalies in most of the Northern Hemisphere are much warmer than climatology for the middle of November. Baltic and Mediterranean temperatures remain well above normal. Pacific Ocean anomalies are similar in size to last month although slightly colder than average in the East Pacific near the North American coast.
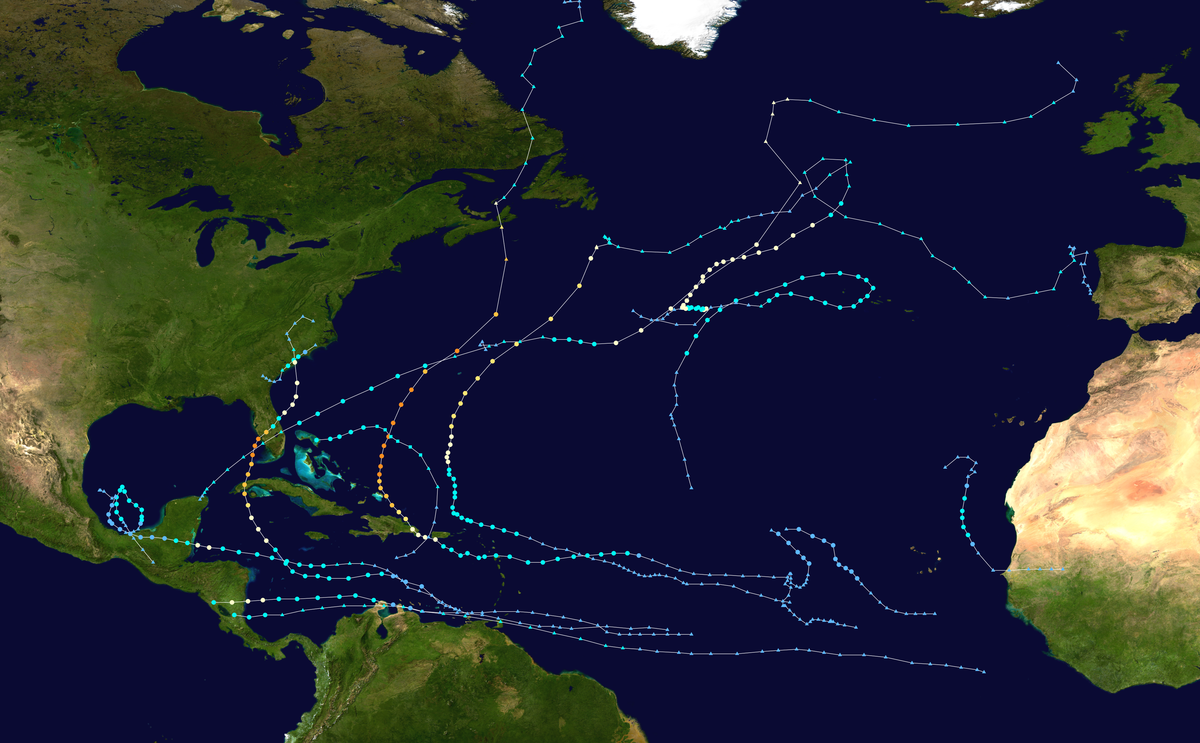
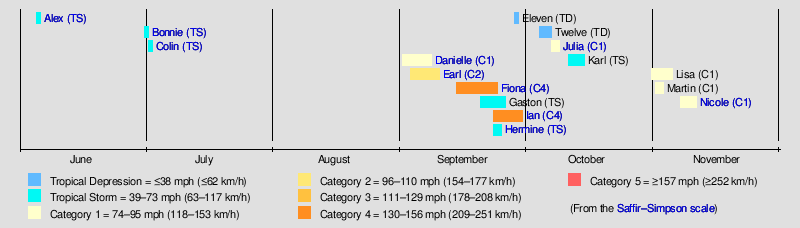
Wikipedia Atlantic tracks to 17th November 2022 are shown above. The tally for 2022 includes 16 depressions, 14 tropical storms, 8 Hurricanes 2 of which were major hurricanes (Cat3+). Estimated fatalities over 337 with total damage over 54 billion US dollars.
Timeline of storms shown below. (Wikipedia)
The Tropical Atlantic sea temperature anomalies remain slightly warmer than average and are forecast to remain slightly warmer through Spring 2023. (see Met Office graphic below).

Forecasts suggest that tropical Pacific Sea Surface Temperatures (nino3.4) are likely to trend towards El Nino conditions from late Spring 2023.

The North Atlantic Oscillation index (500hPa index shown below) has been uncertain/slightly positive recently. The ensemble forecast is for negative conditions to develop although GFS operation model is not so convinced. (CORRECTION) Negative values imply WEAKER westerly winds across the Atlantic towards Europe although a weak signal is inconclusive.
See https://www.metoffice.gov.uk/weather/learn-about/weather/atmosphere/north-atlantic-oscillation
“The negative NAO phase represents the reverse with a weaker than usual difference in pressure.
Winds from the east and north-east are more frequent, bringing with them cold air, while the adjusted position of the jet stream leads to weaker and less frequent storms.
As a result, Europe and eastern US are more likely to experience cold, calm and dry winters. In contrast, northern Canada and Greenland will tend to be mild and wet.”

2. Recent Climatology
SW England: Up to the 17th of November. The temperature has been above average with positive anomalies of between 2 and 4 Celsius, although some of this exaggerated by the typical fall in temperatures through November . Rainfall has been above average with many places already reaching or exceeding the November total and in places almost double the monthly total already.
UK:
Met Office provisional Temperature and Rainfall anomalies for August, September, October 2022 are shown below: The higher rainfall in places during September and October has not offset the “drought” with hosepipe bans still in effect across Cornwall and NW Devon from August 23rd.

Copernicus, European temperature and rainfall anomalies and soil moisture for October 2022 and the year (Nov2021 to Oct 2022) compared with 30 year period 1981-2010.

UK River flows and ground water levels in October 2022 can be found in the October 2022 Hydrological Summary

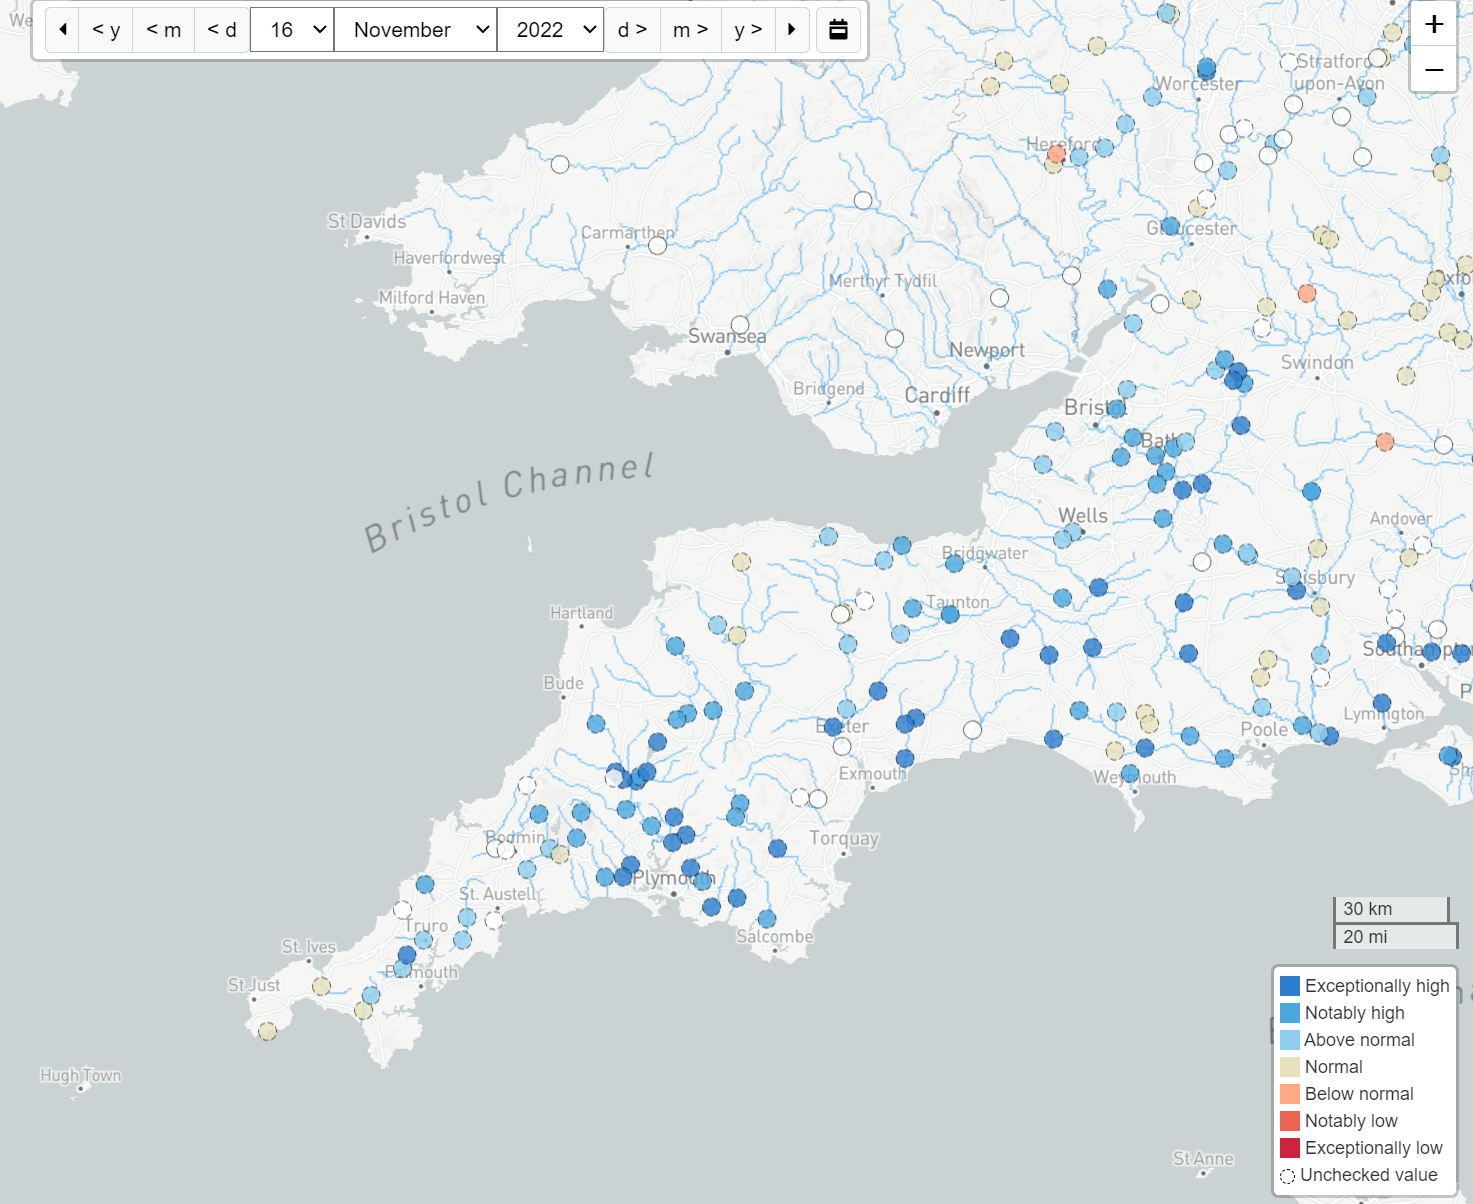
Due to the very wet weather in November 2022 river levels are now above average in many parts of the SW and in some areas are exceptionally high. (see image below for 16th November data from the nrfa.ceh.ac.uk UK water resource portal.)
Reservoir levels, according to SW Water, are well below the long term average across SW England as of 13th November 2022. Of the main reservoirs on Burrator was at almost full capacity.

The Global Flood Awareness System – GloFAS – forecast from November was not available on the 18th.
B: Forecast data:
1. Stratosphere:
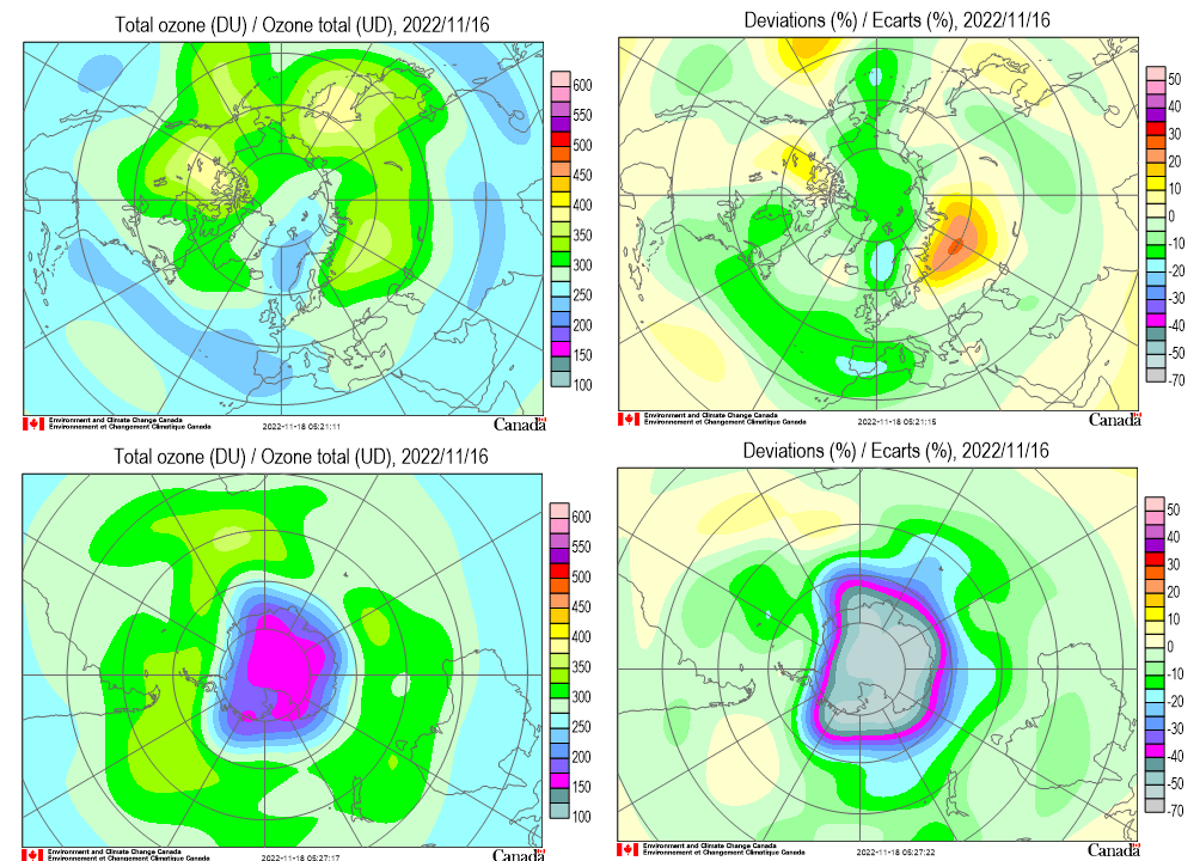
Ozone values and anomalies as at 16th November (are shown above) for the N and S polar regions. A large Ozone hole is evident over the Antarctic.
The stratosphere is in winter mode the N Pole. The images below show the 10hPa height temperature anomaly analysis on the 18th November with a forecast for 22nd. The stratospheric vortex is not very stable and is forecast to split with a reduction in the westerly flow at that level across the Atlantic and UK. It is far too early to say if this will impact of the westerly jet stream and hence the winter temperatures.

2. Upper troposphere:
CFSv2 200hPa contours (top row) and CFSv2 anomaly (lower row) for December 2022 and January and February 2023. The lower anomalies near the W or NW of Uk in January and possible stronger Atlantic jet in February suggest an increasingly unsettled period for the UK.

3. Lower Troposphere:
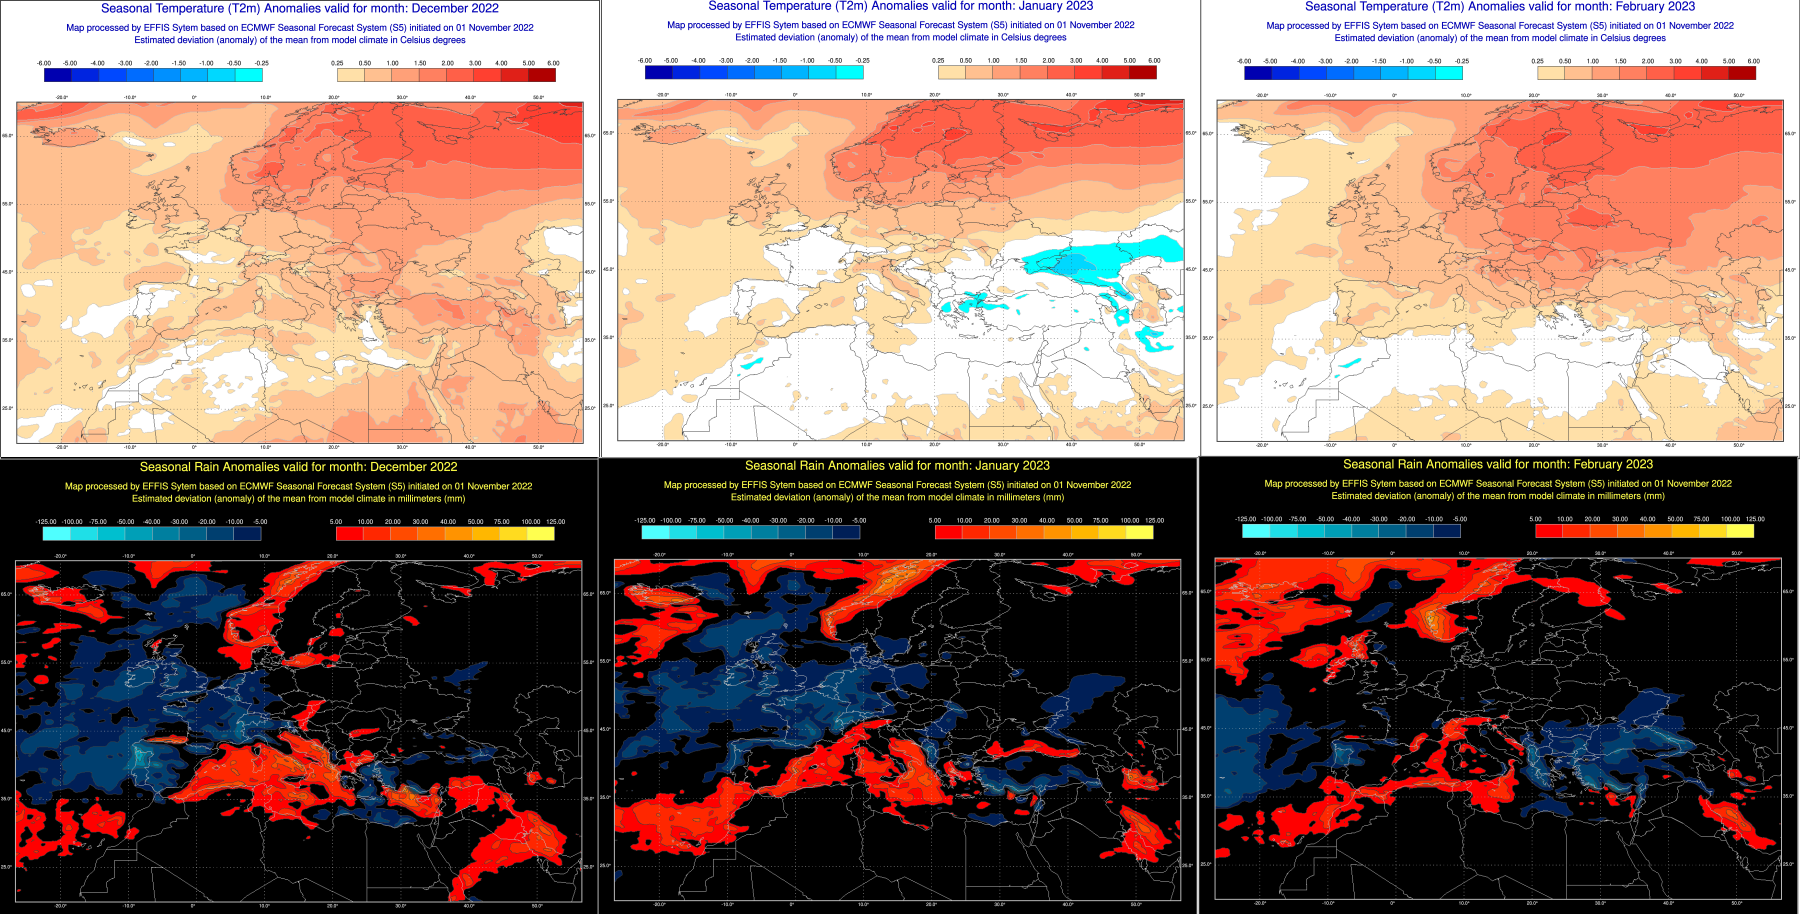
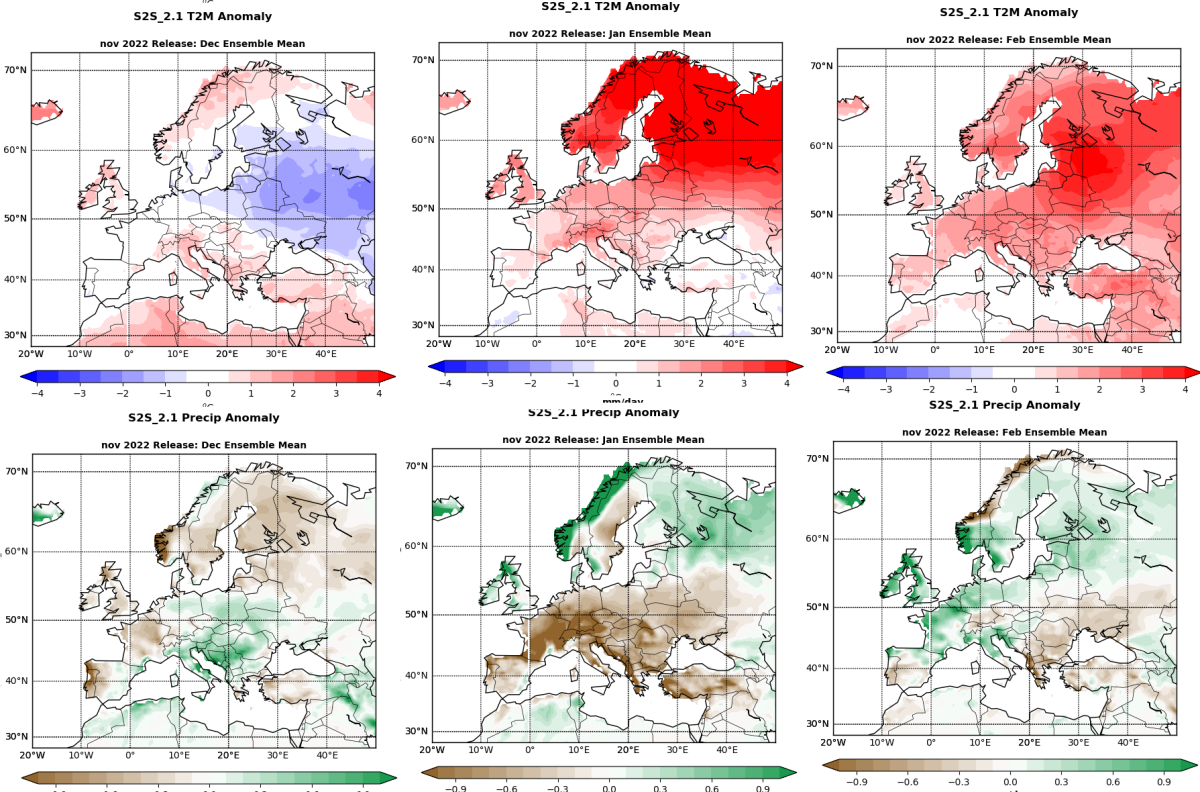
A selection of model solutions for December 2022 to February 2023 using November data are shown below. The full set, including graphics for Sprig 2023 can be found at http://www.weather-info.co.uk/wxsvc/seaslatest.html
Top row temperature anomaly and lower row precipitation anomaly
December to February
CFSv2

NMME

ECMWF
NASA – (below)
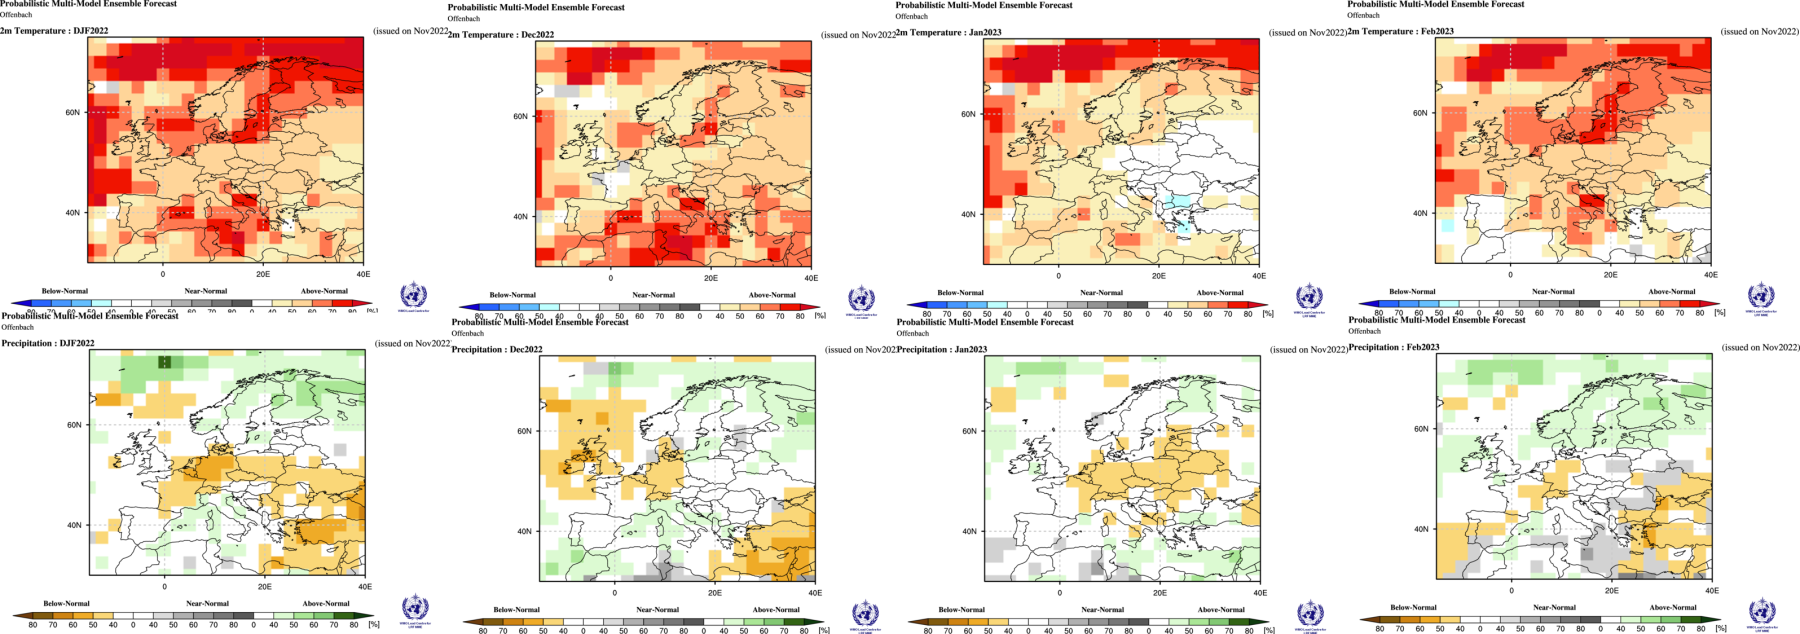
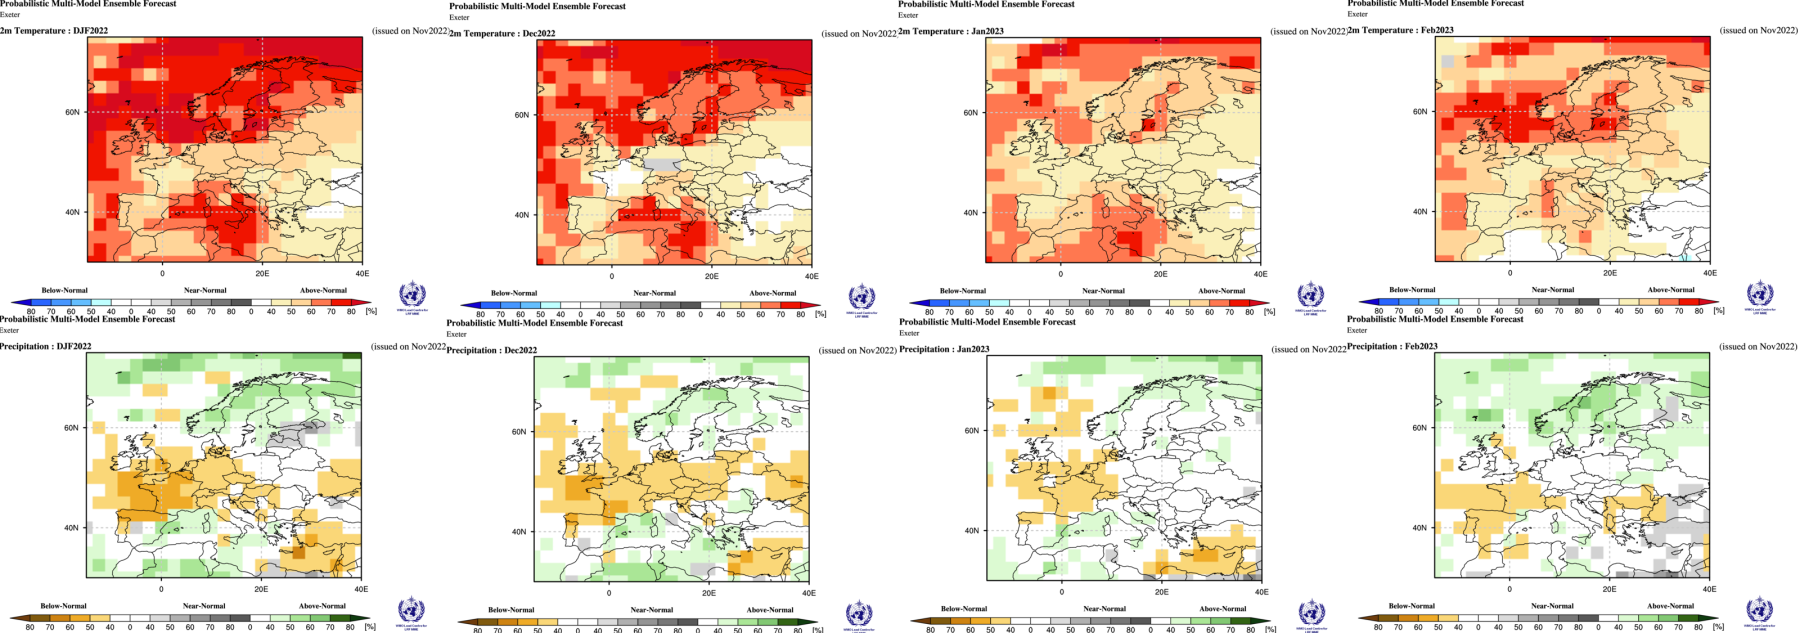
Date from WMO:
Three month average anomaly followed by Dec Jan and Feb. Top row temperature anomaly and lower row precipitation anomaly.
WMO super ensemble (below)

BCC China (below)

BoM Australia (below)

CMCC (below)

CPTEC Brazil (below)

DWD Germany (below)
ECMWF EU (below)

Canada (below)

Moscow Russia (Below)

Korea KMA (Below)

Japan (Below)

France (Below)

UKMO Exeter (Below)
USA Washington (below)

C: Comparing previous output:
August to October 2022 – based upon July 2022 data.
Original Summary — 170722 –
Temperature: Strong signal for above average temperatures. Lower probs of occurance in the North where also lower anomalies. Anomalies in the south 1 C and in some models 1.5 C especilly in August. Several models indicate lower anomalies in October. Rainfall: Indication for drier than average conditions especially in the south. North probably near average for season but may start drier and end wetter. Some agreement for a wetter October more especially across the north and some western exposures with a minority suggesting this starts in September. Sea level pressure: more likely above normal in S..
Comment on the summary: Very good temperature indication. Fairly good rainfall and pressure indication.
Scoring will attempt to state good, fair, poor or no signal.
Revised order
1. Russia (WMO): Temp V Good got the less warm Sept in S . PPN good . (interesting difference with WMO data)
2. USA – CFS2 : Temp fair . PPN fair .
3. UKMO Contingency: Temp good . PPN poor .
4. UKMO : Temp good . PPN poor . PMSL fair
5. USA – IRI : Temp no signal . PPN no signal .
6. KMA APCC : Temp good . PPN no signal.
7. JMA : Temp good . PPN good . PMSL fair
8. NMME : Temp good . PPN good .
9. WMO multi : Temp good . PPN fair.
10. BCC : Temp fair . PPN fair .
11. NASA : Temp good . PPN poor .
12. CanSips : Temp good . PPN fair .
13. Copernicus Temp good . PPN good . PMSL fair
14. CMCC Temp good . PPN fair . PMSL poor
15: DWD Temp good . PPN good . PMSL good
16. EC Temp good . PPN poor . PMSL good
17 JMA Temp good . PPN poor PMSL poor
18 UKMO Temp good . PPN poor . PMSL fair
19. MF Temp good . PPN good . PMSL good
20 NCEP Temp good . PPN fair. PMSL fair
21 ECCC Temp: good . PPN poor. PMSL poor
WMO low res data:
BoM Temp good . PPN fair .
Can Temp good . PPN fair
DWD Temp good . PPN fair.
KMA Temp good . PPN fair .
MOSC Temp poor. PPN fair .
WASH Temp good. PPN fair .
CMA Temp good . PPN fair
ECMWF Temp good . PPN good .
UK Temp good . PPN poor .
JMA Temp good . PPN poor
MF Temp good . PPN fair.
CMCC Temp good. PPN poor .
CPTEC Temp good. PPN fair .
Verification details can be found here: http://www.weather-info.co.uk/wxsvc/Verification.html
D: Text Forecast for SW England
Winter 2022/23 (December January February).
Temperature forecasts continue to suggest a milder than average winter. Each month may well be above average but December may be closer to average and there is a chance of a colder spell during the month. A caution is that over recent years models have not picked out a colder spell more than about two or three weeks ahead.
Rainfall forecast is for near average or below average for the season. Near average may be a result of averaging out between the wetter and drier model solutions. December possibly near or below average other months not clear cut. Snowfall likely to be below average, which means little if any snow for lower ground but some snow over the moors. Snow may be less likely in February and slightly more likely in December than average (again most likely over the moors).
Winter Climate: 1981-2010 average temperature values for lowland areas 7°C in the West and 5°C in the East. Rainfall; Dec and Jan typically wetter than February. 1981-2010 Autumn average 300-400 mm lowlands but 200-300 mm areas to E of Dartmoor. Snow climatology less than 5 days lying snow over lowland areas 5 to 10 hills, say hills around 200 metre elevation – one in three years have no lying snow.
Spring 2023 (March April May)
Overall milder than average temperatures, perhaps nearer normal May. Near or above average rainfall,
Spring climate: 1981-2010 average mean temperature 9 or 10°C but a few degrees cooler over the moors. Roughly Mar 7 or 8°C Apr 8 or 9°C May 11 or 12°C. Average 1981 to 2010 rain 200 to 300mm lowest values in E Devon and over parts of Somerset
Summer 2023 (June July August) Limited data
Above normal temperatures indicated with below average rain early in the summer but above average later.
Summer climate: 1981 to 2010 average daily mean temperature 14 or 15°C in many areas to 16 or 17°C in main urban areas also locally east of the moors and more widely in Somerset. Maximum temperatures average 19 to over 21°C in similar areas. July often warmer than August. Average 1981 to 2010 rain 300mm over the moors, typically 200 to 250mm in many coastal and eastern areas. June often drier than July and July drier than August.
E. Caution.
Experimental Long Range Forecasts do not have a good success rate. especially with regards to precipitation. The models are good at predicting above average values but not for picking out a one off colder month. The data used for the above forecast summary can be seen at here.
The attempt at a Regional Forecast for SW England aims to test whether such a forecast of temperature and rainfall variation from average can be made using numerical model data available on the internet. The forecast should not be used for any other purpose. A brief verification summary for the UK and Eire is routinely published at http://www.weather-info.co.uk/wxsvc/Verification.html or Click here for the Teignmouth and Dawlish summary
F: References.
SST anomaly NOAA Remote Sens. 2014, 6(11), 11579-11606; doi:10.3390/rs61111579
IRI statistics: Mason, S.J. and L. Goddard, 2001: Probabilistic precipitation anomalies associated with ENSO. Bull. Amer. Meteor. Soc., 82, 619-638.
UK climate details see: http://www.metoffice.gov.uk/public/weather/climate/
NMME information: http://journals.ametsoc.org/doi/abs/10.1175/BAMS-D-12-00050.1
CFS2 info
GLOFAS Acknowledgement: Data were provided by the Global Flood Awareness System – GloFAS (http://www.globalfloods.eu/) of the European Commission Joint Research Centre and the European Centre for Medium-Range Weather Forecasts.
Reference: Alfieri, L., Burek, P., Dutra, E., Krzeminski, B., Muraro, D., Thielen, J., and Pappenberger, F.: GloFAS – global ensemble streamflow forecasting and flood early warning, Hydrol. Earth Syst. Sci., 17, 1161-1175, doi:10.5194/hess-17-1161-2013, 2013.
‘Copernicus Products’ as listed in the C3S or CAMS Service Product Specification or any other items available through an ECMWF Copernicus http://climate.copernicus.eu
International seasonal monthly data from WMO
Stratospheric Diagnostics from Japan Met Agency and ECMWF via Free University Berlin
Climate data from The Met Office UK and NCEP USA
Contains public sector information licensed under the Open Government Licence v3.0.
