Published 20 January 2023.
GDPR statement: Please note that the author of this blog does not set cookies but the host “wordpress.com” sets multiple cookies which are outside of the authors control. You can view their cookie policy here.
A: Overview
1. Influences.
Changes in sea temperature
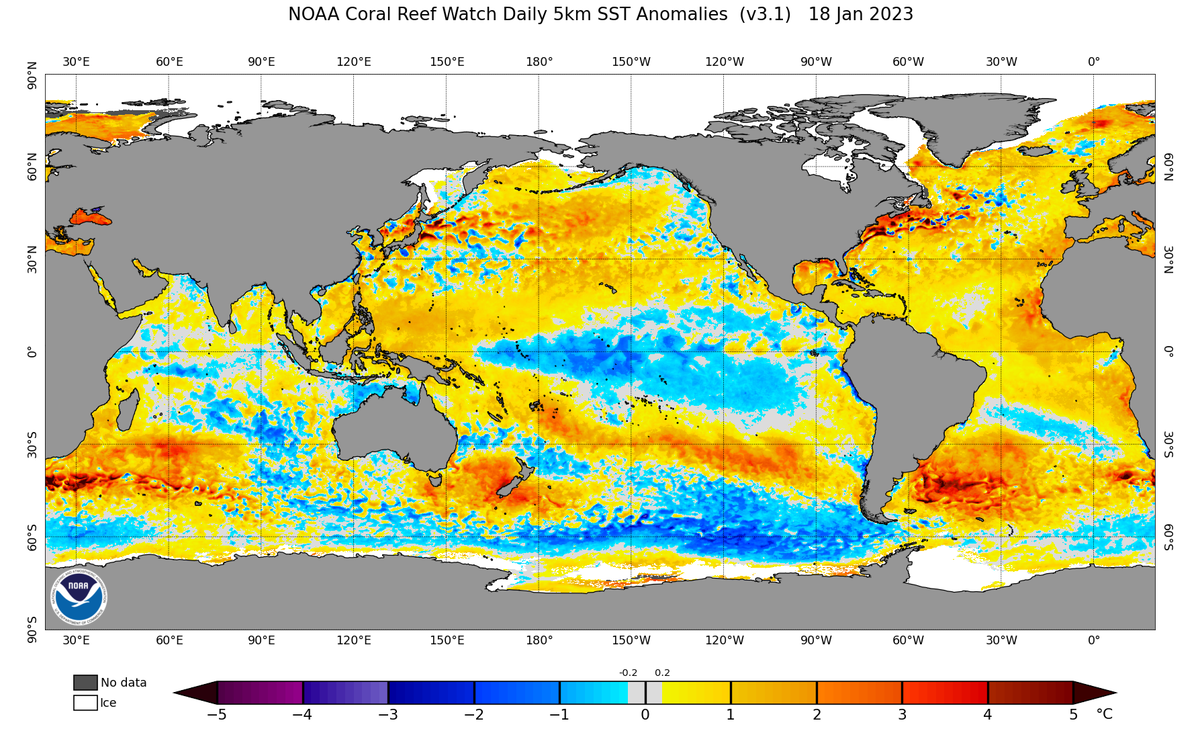
Sea temperature anomalies in most of the Northern Hemisphere remain warmer than climatology for the middle of January. Baltic and Mediterranean temperatures remain well above normal. Pacific Ocean anomalies are similar in size to last month although the area of slightly colder than average temperature in the East Pacific near the North American coast has slightly reduced anomalies..
Antarctic anomalies showing positive values near 150 deg W.
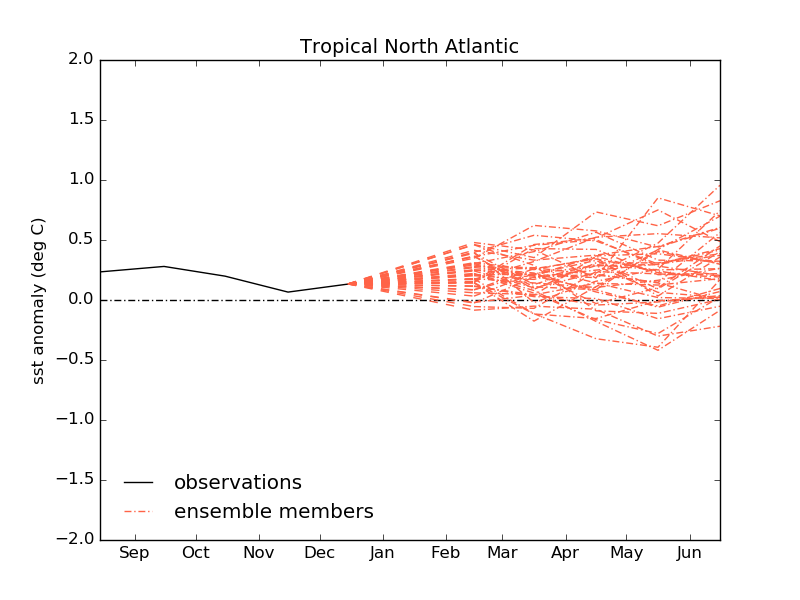
The Tropical Atlantic sea temperature anomalies remain slightly warmer than average and are forecast to maintain similar anomalies through Spring and into early summer 2023. (see Met Office graphic below).
Forecasts suggest that tropical Pacific Sea Surface Temperatures (Nino3.4) are likely to move to El Nino conditions from late Spring 2023 which may help increase global average temperatures for 2023.

The North Atlantic Oscillation index (500hPa index shown below) has been marginally positive recently. The ensemble forecast is for neutral or slightly negative conditions. Negative values imply WEAKER westerly winds across the Atlantic towards Europe although a neutral or weak signal is inconclusive.
See https://www.metoffice.gov.uk/weather/learn-about/weather/atmosphere/north-atlantic-oscillation
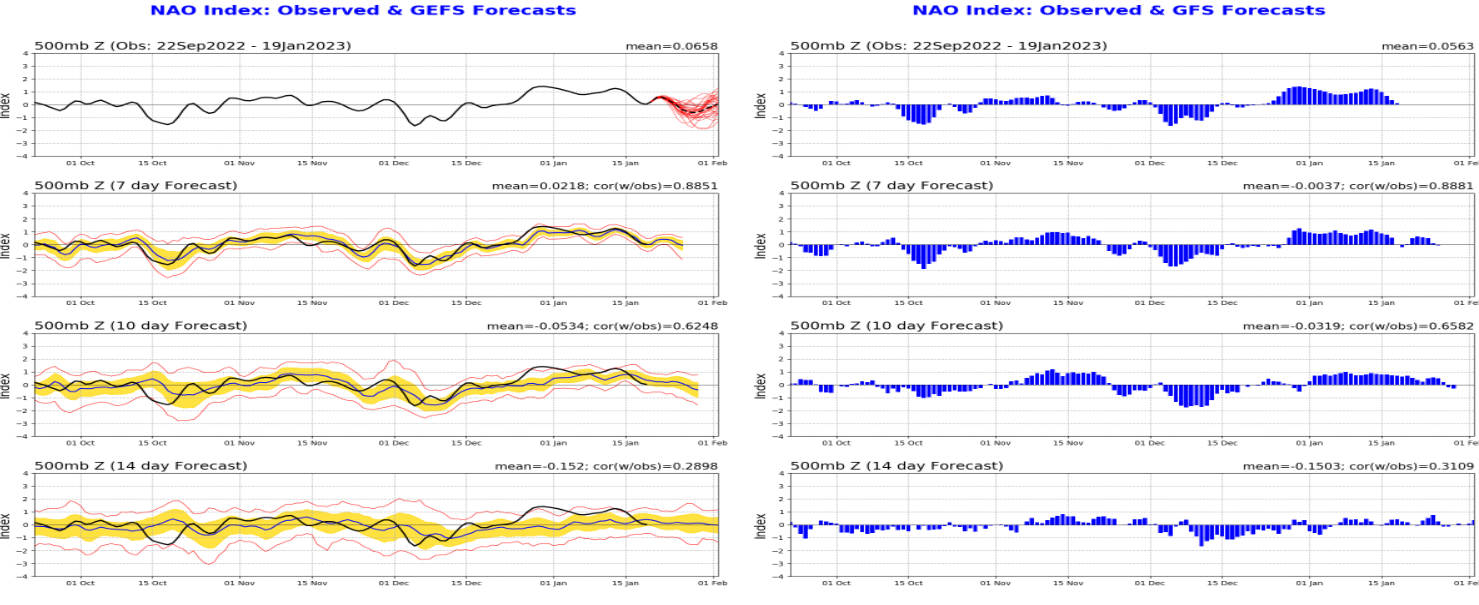
The negative NAO phase represents the reverse with a weaker than usual difference in pressure.
Winds from the east and north-east are more frequent, bringing with them cold air, while the adjusted position of the jet stream leads to weaker and less frequent storms. Consequently, Europe and eastern US are more likely to experience cold, calm and dry winters. In contrast, northern Canada and Greenland will tend to be mild and wet.
2. Recent Climatology
SW England
Up to the 19th of January, despite the recent cold days, the average temperature has been between 7 and 9C in most areas which is about 1.5C above average. This anomaly may well reduce given lower than average values for at least parts of the remainder of January. Rainfall has been above average for the month already and over the last few days there has been some snow in places, especially over the moors and across parts of Cornwall
UK:
Met Office provisional Temperature and Rainfall anomalies for October November December and the Year 2022 are shown below: The higher rainfall in places during November has gone some way to recovering reservoir levels in Cornwall although northern parts of the region were less wet than southern parts. December was the first colder than average month of 2022 and for southern areas since August 2021.

Copernicus, European temperature and rainfall anomalies for December 2022 and the year (Jan to Dec 2022) compared with 30 year period 1981-2010, are shown below..

UK River flows and ground water levels in December 2022 can be found in the January 2023 Hydrological Summary

Recent wet weather meant that levels recovered in many parts of the SW during December and in January. Data from the nrfa.ceh.ac.uk UK water resource portal shown below:

Reservoir levels, according to SW Water remain below the long term average across SW England as of 15th January 2023. Some of the reservoirs are at 100% capacity except in the N and W of the region, for details check SW Water website.

The Global Flood Awareness System – GloFAS – forecast from January 1st to end of April 2023 shows an elevated river flood risk in Scotland and a normal risk elsewhere.

B: Forecast data:
1. Stratosphere:

Ozone values and deviation from average for the northern hemisphere are shown above as of 18th January 2023.
Temperature in the upper stratosphere over the N Pole at 19 and 30hPa is shown below. Some recovery from very low values at 10hPa are starting.

The stratosphere is in winter mode the N Pole at present but a major warming event is likely to occur later in January. The images below show the 10hPa height temperature anomaly analysis on the 19th January with selected forecast frames to 4th February. The stratospheric vortex is forecast to relocate and weaken as strong warming takes place. Despite the warming a westerly flow is maintained above UK and Europe in this forecast, A reversal of the flow takes place over USA and Canada and this may impact the surface weather evolution later in February and into March. It is too early to say if this will be the start of an early transition to “summer” mode for the stratospheric circulation.

2. Upper troposphere:
CFSv2 200hPa contours (top row) and CFSv2 anomaly (middle row) NMME anomaly (lower row) for and February, March and April 2023. The lower anomalies near the W of UK in February suggest a stronger Atlantic jet in February leading to an unsettled and possibly stormy period of weather for the UK. This risk markedly reduced for March and April in this forecast sequence.

3. Lower Troposphere:
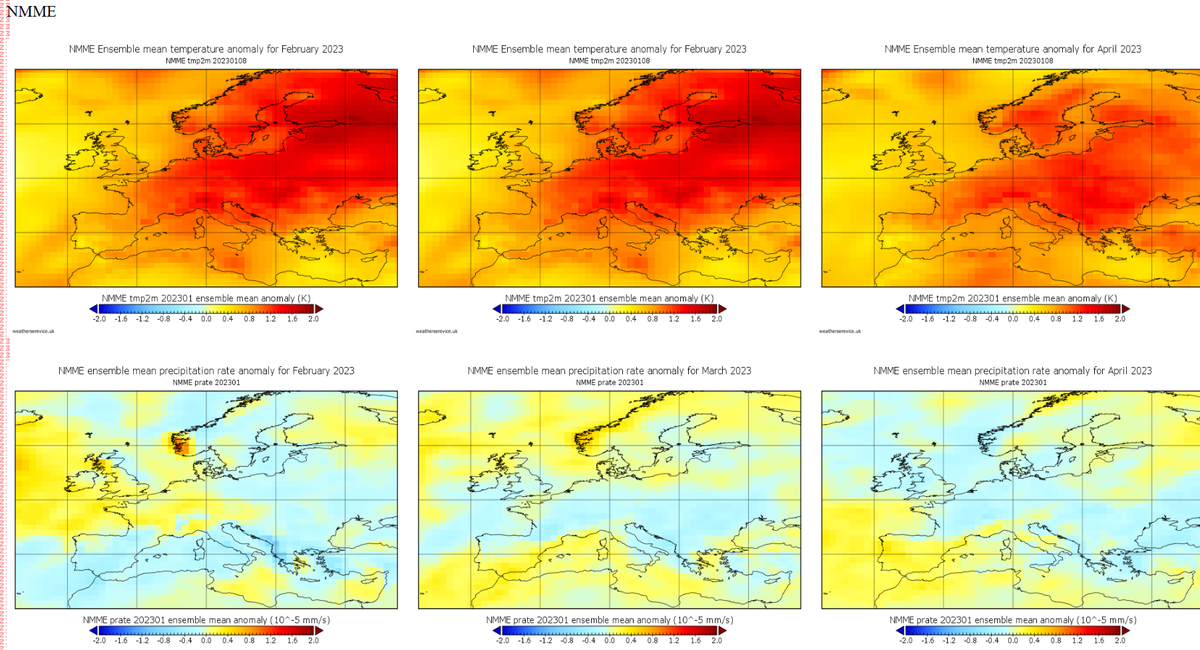
A selection of model solutions for February to April 2023 using January data are shown below. The full set, including graphics for Spring 2023 can be found at https://www.weather-info.co.uk/wxsvc/seaslatest.html
Top row temperature anomaly and lower row precipitation anomaly
February to April 2023
CFSv2 E3 data

NMME
ECMWF

NASA

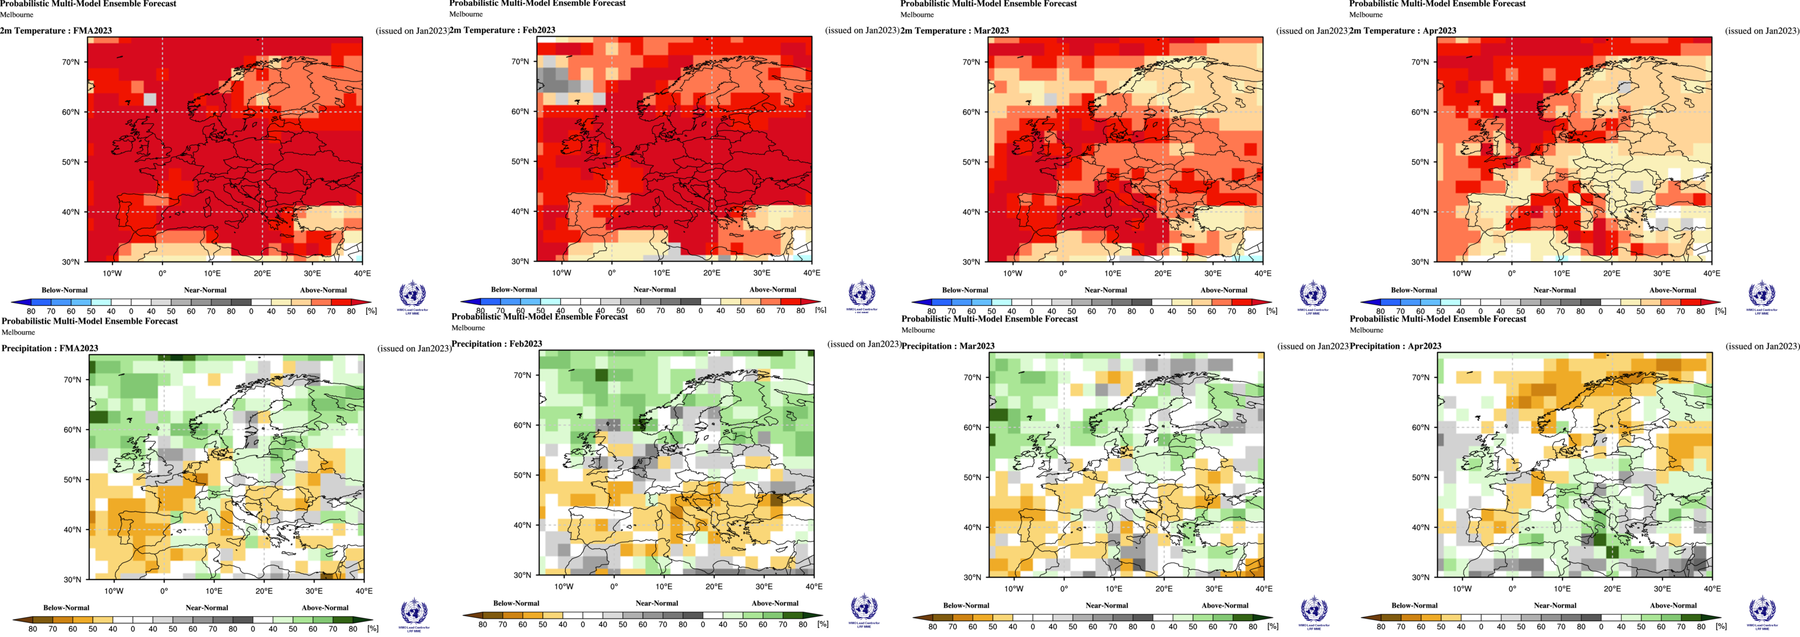
Data from WMO:
Three month average anomaly followed by Feb March April. Top row temperature anomaly and lower row precipitation anomaly.
WMO super ensemble (below) is a mean of data supplied by National Meteorological organisations across the globe. Because of the amount of data the output is a low resolution. (Exeter UKMO data missing from WMO server as of 20JAN2023)

Individual members of the WMO super ensemble are shown below.
BCC China (below)

BoM Australian (below)
CMCC (below)

CPTEC Brazil (below)

DWD Germany (below)

ECMWF (below)

CMA Canada (Below)

Moscow Russia (below):

Korea KMA (below):

Japan (below):

France (below):

UKMO Exeter – missing
USA Washington (below):

WMO super ensemble (below) for March April May: Indeterminate rainfall due to cancelling out of above and below forecasts from the various model output.
Graphics for Spring 2023 can be found at https://www.weather-info.co.uk/wxsvc/seaslatest.html

C: Comparing previous output:
October to December 2022 – based upon September 2022 data.
Full review data available here https://www.weather-info.co.uk/wxsvc/VerifOND2022.html
Original Summary – 200922 –
Above normal temperature is forecast for the season and each month although a limited number of models suggest December could have nearer normal values. Rainfall near normal for many areas but above in the N mainly NW and chance of below normal in the S/SW. Some suggestion that October could see well above normal rainfall and December less so and even below average. Pressure possibly above average.
Comment on the summary: Models continue to underestimate the occurrence of colder than average months. Overall forecast for above normal weas correct as was the suggestion that December cold be nearer average hinting at a colder month. Rainfall forecast of near average was OK for parts of England and Scotland but for most areas was under estimate of rainfall. Pressure forecast was poor.
Scoring will attempt to state Temperatures: good (if December was colder month), fair (above average for the 3 months), poor or no signal. Rainfall good for above average for season.
Revised order
1. Russia (combined): Temp fair . PPN good .
2. USA – CFS2 : Temp fair . PPN fair .
3. UKMO Contingency: Temp poor . PPN poor .
4. UKMO : Temp fair . PPN poor . PMSL poor
5. USA – IRI : Temp fair . PPN poor .
6. KMA APCC : Temp fair . PPN poor .
7. JMA : Temp good . PPN poor . PMSL poor
8. NMME : Temp fair . PPN good .
9. WMO multi : Temp fair . PPN poor .
10. BCC : Temp fair . PPN poor .
11. NASA : Temp fair . PPN poor .
12. CanSips : Temp good. PPN fair .
13. Copernicus Temp fair . PPN poor . PMSL poor
14. CMCC Temp fair . PPN poor . PMSL poor
15: DWD Temp fair. PPN poor . PMSL poor
16. EC Temp . PPN poor . PMSL poor
17 JMA Temp fair. PPN poor . PMSL poor
18 UKMO Temp fair . PPN poor . PMSL poor
19. MF Temp fair . PPN poor . PMSL poor
20 NCEP Temp fair . PPN poor . PMSL poor
21 ECCC Temp: fair. PPN poor . PMSL fair
WMO low res data:
BoM Temp fair . PPN poor .
Can Temp good . PPN fair .
DWD Temp fair . PPN poor .
KMA Temp GOOD . PPN poor .
MOSC Temp good . PPN poor .
WASH Temp fair . PPN poor .
CMA Temp fair . PPN poor .
ECMWF Temp fair . PPN poor .
UK Temp fair . PPN poor .
JMA Temp fair . PPN poor
MF Temp fair . PPN poor .
CMCC Temp good . PPN poor .
CPTEC Temp fair . PPN good .
D: Text Forecast for SW England
Remainder of Winter 2022/23 (February 2023).
After a cold start February is likely to be unsettled and milder than average although there is a chance of a colder end to the month.
Increased risk of gales.
Rainfall forecast (low confidence) is for above average rainfall, especially in western exposures and over the moors. Reduced snowfall compared to average although a small risk of snowfall remains for late in the month, mostly over hills.
Caution:
1: Due to large scale stratospheric warming out of the polar vortex there is increased uncertainty for the second half of February and for March. At present the indications are for a mostly mild and unsettled period which could lead to an early Spring.
2: Large scale blocking with cold easterly types seem to only be forecastable about two weeks ahead.
Winter Climate: 1981-2010 February average temperature values for lowland areas 6 or7°C in the West and 5 or 6°C in the East. Rainfall; February, lowland areas 80-100mm but 60-80mm in east. Around 200mm over moors. Snow climatology February possibly around 2 days on average with lying snow for low ground less than 5 days lying snow over lowland areas 5 to 10 hills, say hills around 200 metre elevation – one in three years have no lying snow.
Spring 2023 (March April May)
Overall milder than average temperature for the season. Chance of nearer normal in both March and May. Rainfall near normal. Slightly more indication of below average in April but a lot of inconsistency between models.
Spring climate: 1981-2010 average mean temperature 9 or 10°C but a few degrees cooler over the moors. Roughly Mar 7 or 8°C Apr 8 or 9°C May 11 or 12°C. Average 1981 to 2010 rain 200 to 300mm lowest values in E Devon and over parts of Somerset
Summer 2023 (June July August) Limited data
Temperature likely to be slightly above average. Rainfall uncertain, near or above average overall but despite this number of rain days could be below average.
Summer climate: 1981 to 2010 average daily mean temperature 14 or 15°C in many areas to 16 or 17°C in main urban areas also locally east of the moors and more widely in Somerset. Maximum temperatures average 19 to over 21°C in similar areas. July often warmer than August. Average 1981 to 2010 rain 300mm over the moors, typically 200 to 250mm in many coastal and eastern areas. June often drier than July and July drier than August.
Autumn 2023 (September October November) very limited data.
Milder and wetter than average although just a hint some drier periods but this time suggestion is for October and / or November rather than September which was indicated in the December summary.
Autumn climate: 1981 to 2010 average mean temperature 11 or 12°C but nearer 10°C in rural areas. Maximum temperatures average 14 to 16°C. November normally colder than October which is colder than September. Average 1981 to 2010 rain 300 to 400mm, 600 to 800mm over the moors but east of the moors and in lowland Somerset more like 200 to 300mm. September often drier than October or November.
E: Caution.
Experimental Long Range Forecasts do not have a good success rate. especially with regards to precipitation. The models are good at predicting above average values but not for picking out a one off colder month. The data used for the above forecast summary can be seen at here.
The attempt at a Regional Forecast for SW England aims to test whether such a forecast of temperature and rainfall variation from average can be made using numerical model data available on the internet. The forecast should not be used for any other purpose. A brief verification summary for the UK and Eire is routinely published at http://www.weather-info.co.uk/wxsvc/Verification.html or Click here for the Teignmouth and Dawlish summary
F: References.
SST anomaly NOAA Remote Sens. 2014, 6(11), 11579-11606; doi:10.3390/rs61111579
IRI statistics: Mason, S.J. and L. Goddard, 2001: Probabilistic precipitation anomalies associated with ENSO. Bull. Amer. Meteor. Soc., 82, 619-638.
UK climate details see: http://www.metoffice.gov.uk/public/weather/climate/
NMME information: http://journals.ametsoc.org/doi/abs/10.1175/BAMS-D-12-00050.1
CFS2 info
GLOFAS Acknowledgement: Data were provided by the Global Flood Awareness System – GloFAS (http://www.globalfloods.eu/) of the European Commission Joint Research Centre and the European Centre for Medium-Range Weather Forecasts.
Reference: Alfieri, L., Burek, P., Dutra, E., Krzeminski, B., Muraro, D., Thielen, J., and Pappenberger, F.: GloFAS – global ensemble streamflow forecasting and flood early warning, Hydrol. Earth Syst. Sci., 17, 1161-1175, doi:10.5194/hess-17-1161-2013, 2013.
‘Copernicus Products’ as listed in the C3S or CAMS Service Product Specification or any other items available through an ECMWF Copernicus http://climate.copernicus.eu
International seasonal monthly data from WMO
Climate data from The Met Office UK and NCEP USA
Contains public sector information licensed under the Open Government Licence v3.0.
