Published 20 June 2023.
GDPR statement: Please note that the author of this blog does not set cookies but the host “wordpress.com” sets multiple cookies which are outside of the authors control. You can view their cookie policy here.
A: Overview
1. Influences.
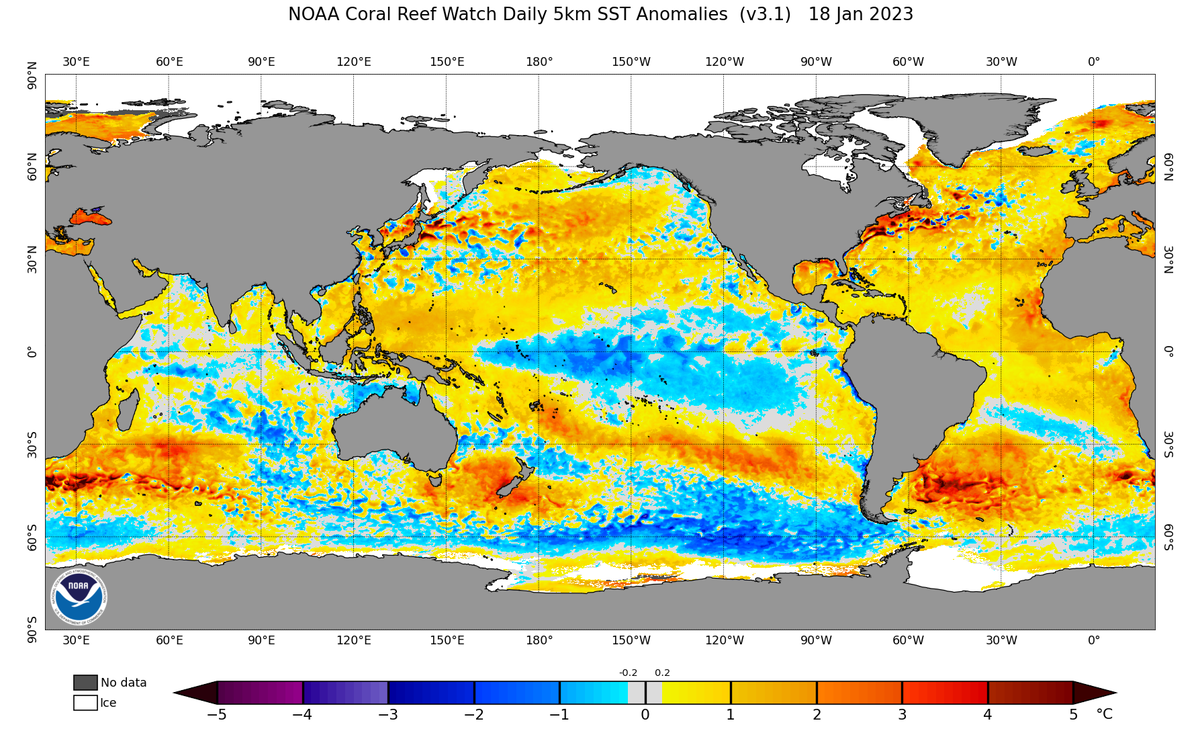
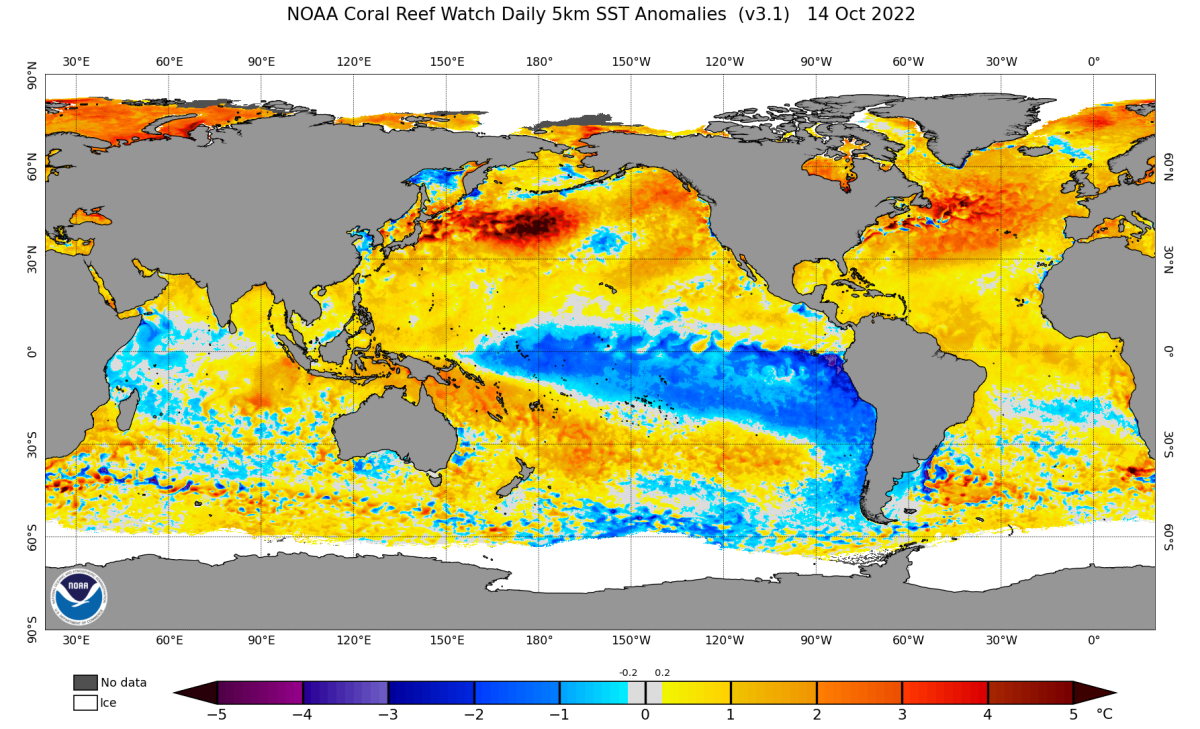
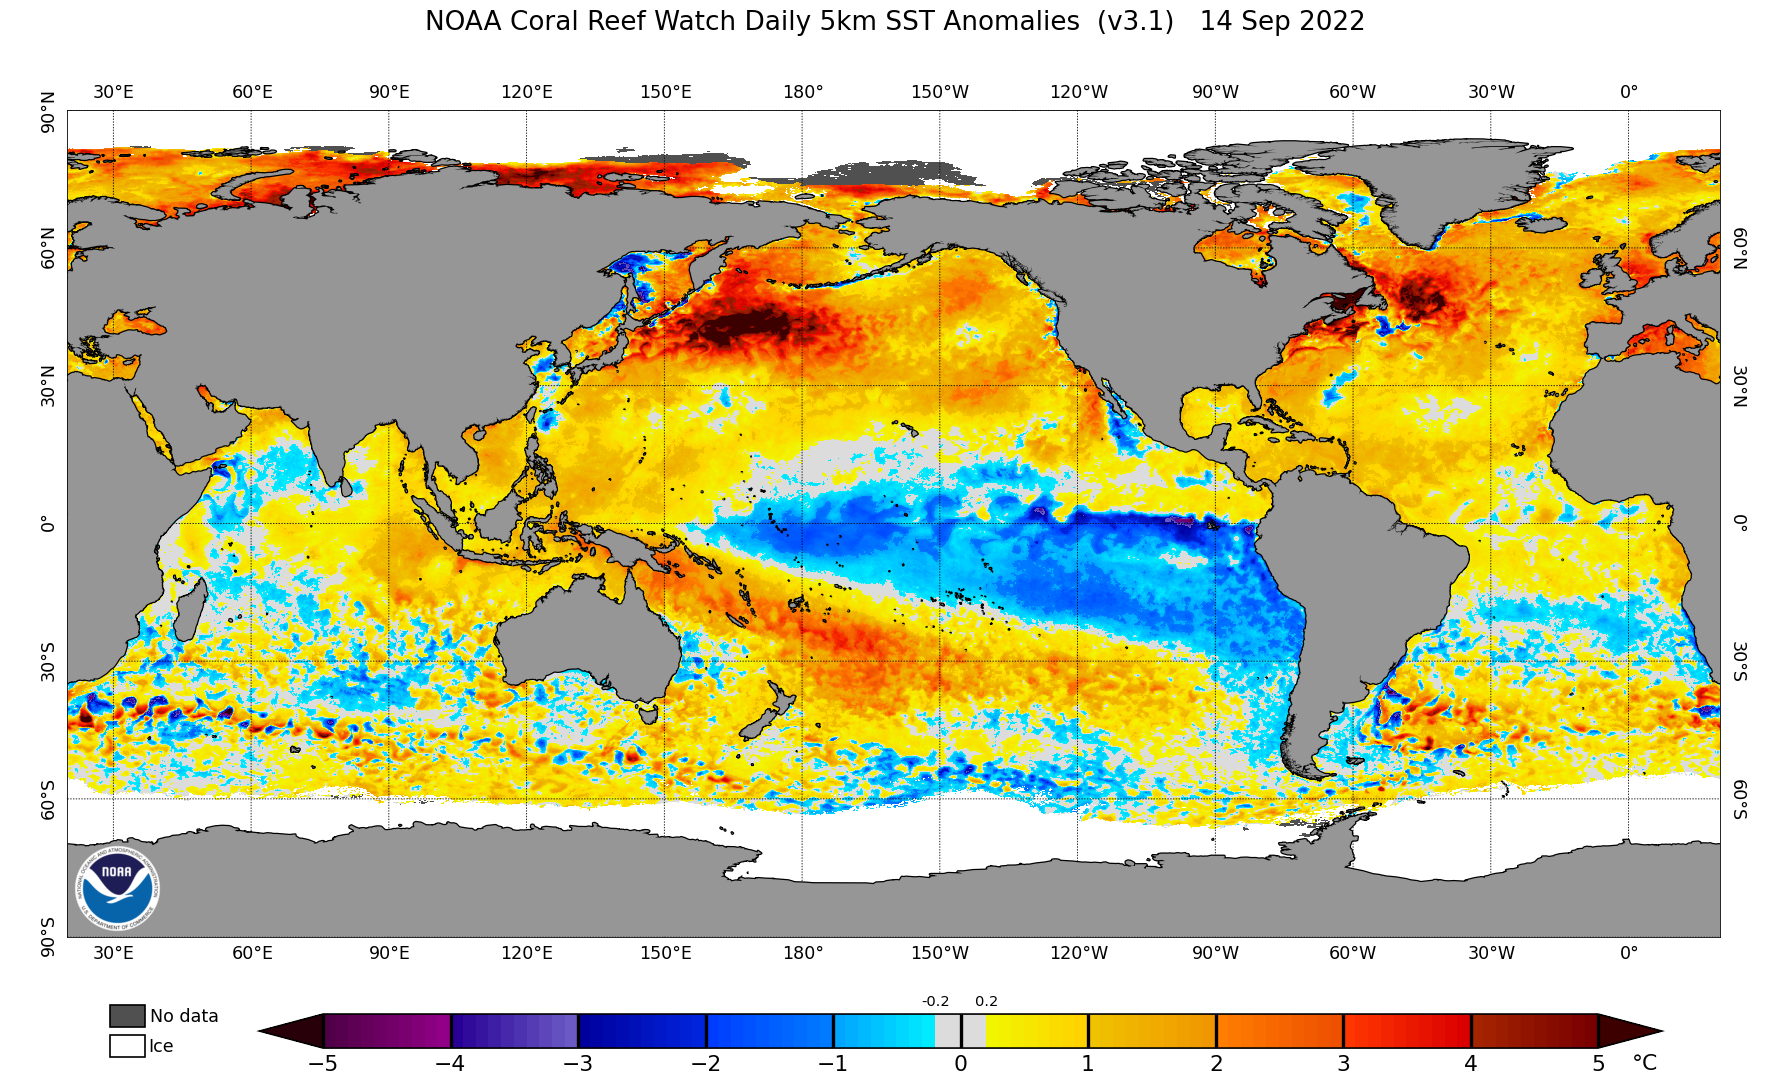
Changes in sea temperature

Sea temperature anomalies in most of the North Atlantic remain warmer than climatology for the middle of June. Areas around the UK, western Europe, western Mediterranean and the Baltic show 3 to 5 Celsius anomalies. Pacific Ocean anomalies along the equator show established El Nino state. The extent of the cold anomaly to the west of North America has increased in size a little. Temperatures in the NE of the Adriatic sea show a cold anomaly following the very severe cyclonic storm storm Biparjoy which brought flooding to parts of N India over recent days.

Biparjoy made landfall on June 16 near Naliya, India, with sustained winds of 95 km/h (60 mph) having weaken prior to landfall but continued to produced heavy rains as the weakening storm moved east for several days. Almost 180,000 people in Pakistan/India were evacuated. Final damage and casualty numbers are not yet available but so far 17 fatalities have been recorded.
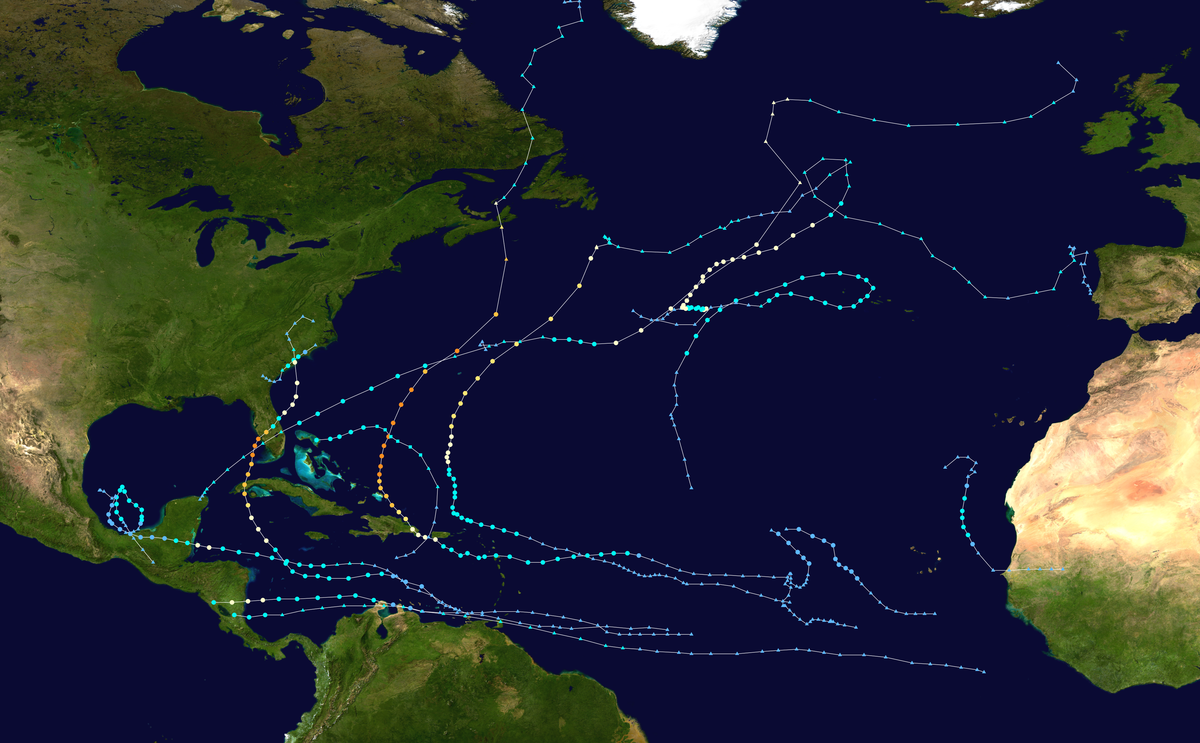
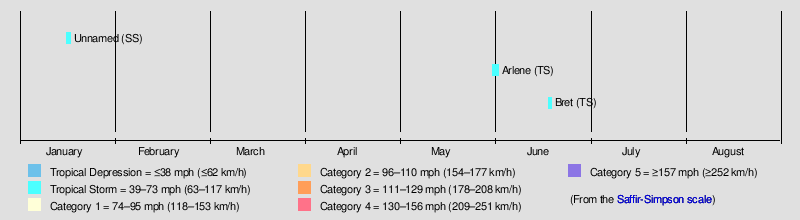
The Atlantic Hurricane season for 2023 is just starting and there are currently two systems being monitored for development (Bret and 93L)
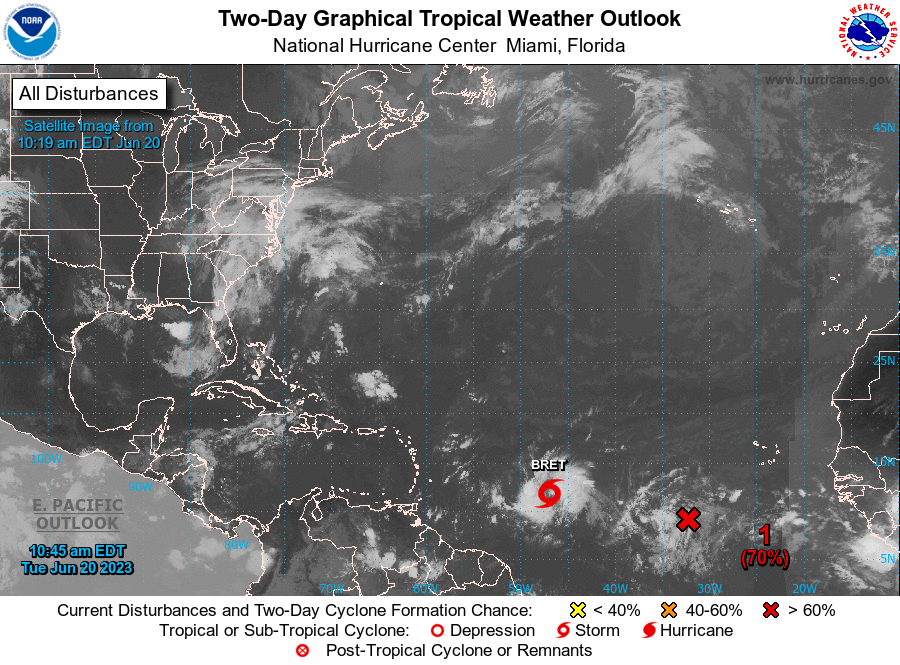
Confirmed tracks so far in 2023 are shown below. (Wikipedia)

Timeline: Arlene became a tropical storm but not a Hurricane. Bret and 93L are forecast to be tropical storms but it is not certain they whether one or both will develop further.
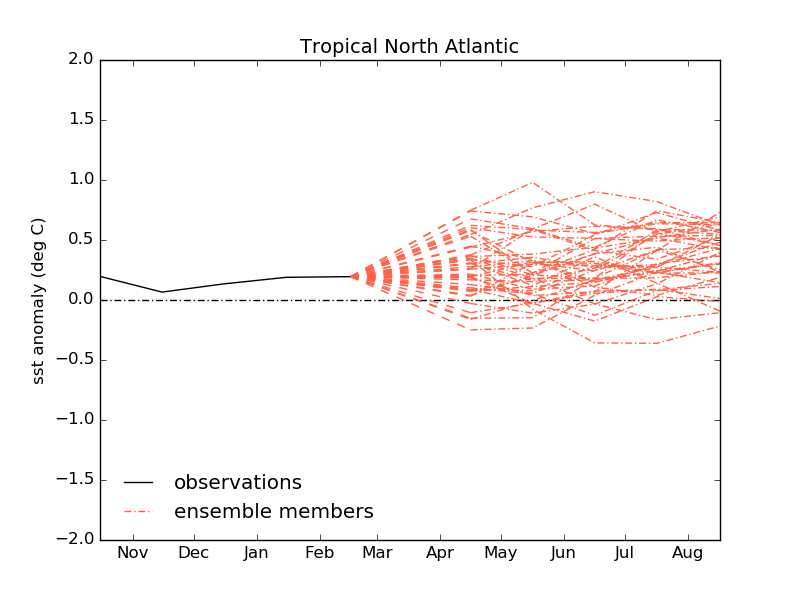
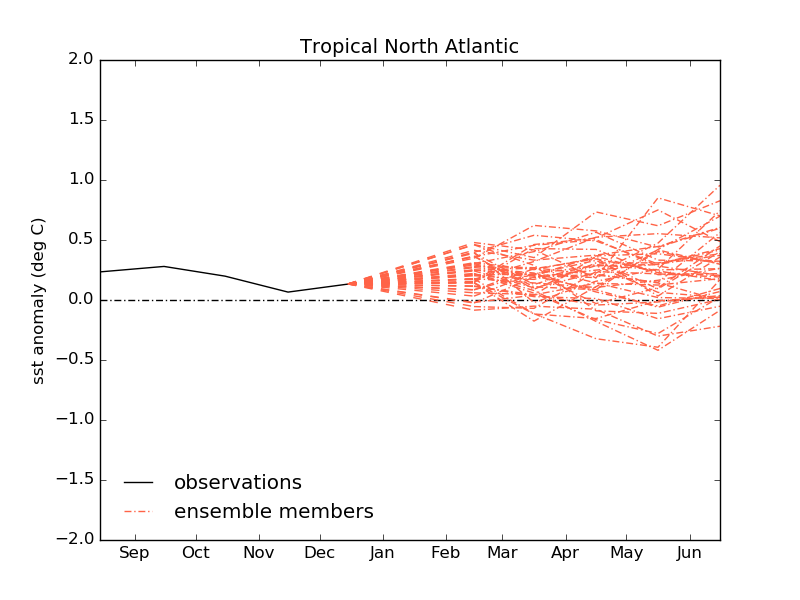
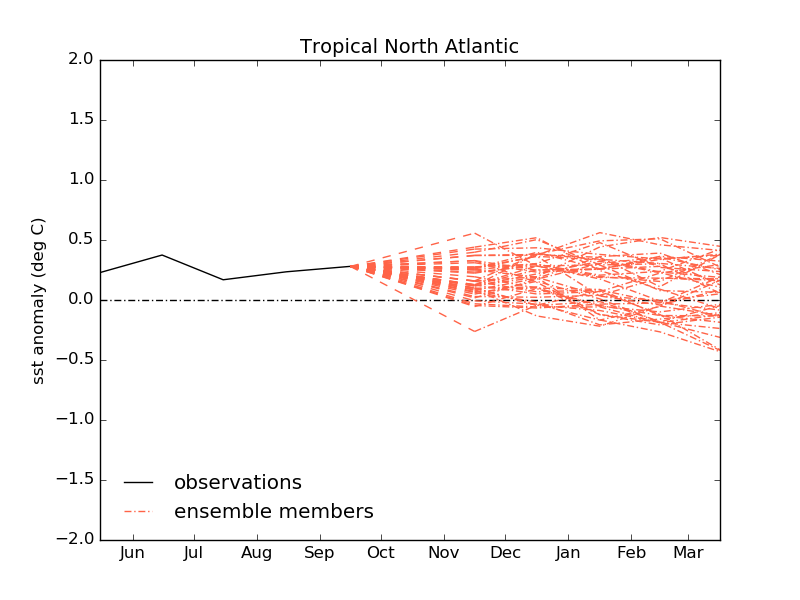
The Tropical Atlantic sea temperature anomalies are warmer than average, also at the higher end of the ensemble forecast from last month. Sea temperature in the tropical region are forecast to maintain similar anomalies through Autumn 2023. (see Met Office graphic below).

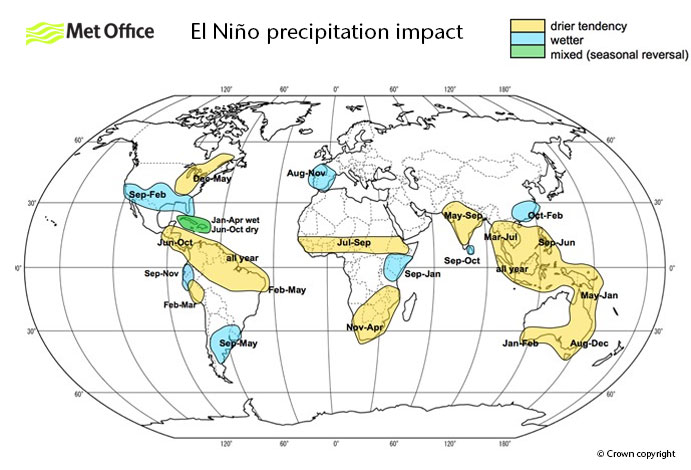
Ttropical Pacific Sea Surface Temperatures (Nino3.4) are in an El Nino state and forecast to remain so into 2024. This may result in a higher global average temperature for 2023 and there are suggestions that over the next few years the global temperature average will set a new record.

The effects of the El-Nino may be difficult to predict due to the excessive heat in water around coastal western Europe.
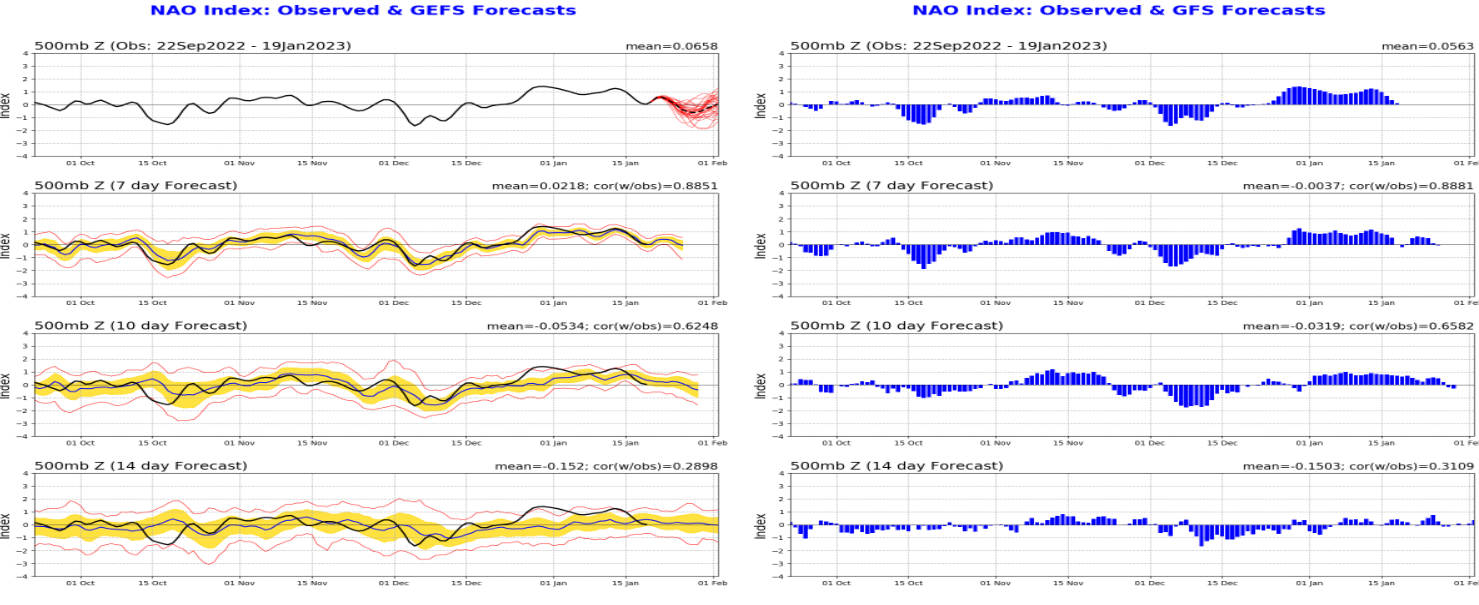
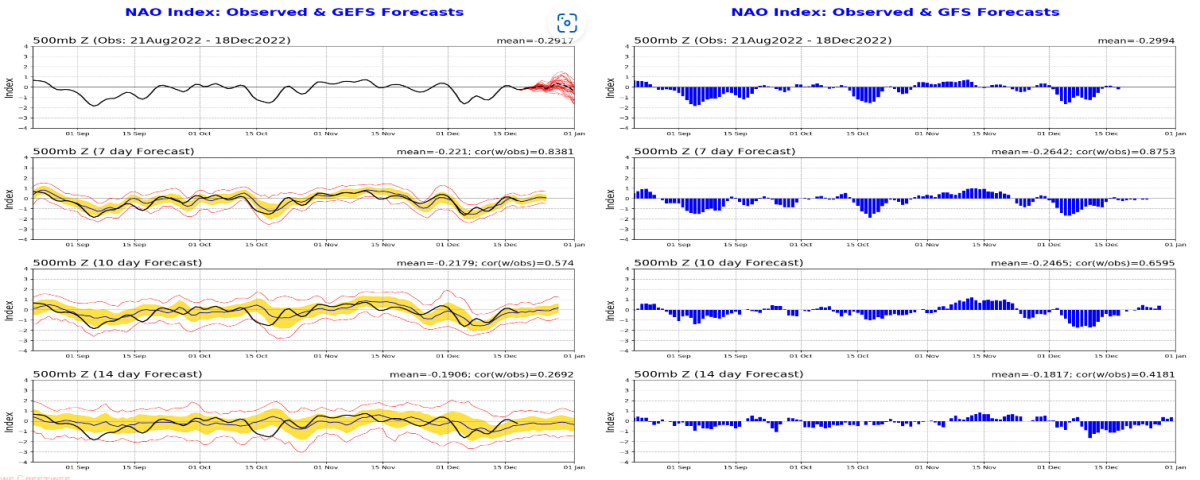
The North Atlantic Oscillation index (500hPa index shown below) became positive again around the 17th of June forecast to turn to neutral state over the next few weeks. Affects on the UK area are inconclusive for a neutral state.
See https://www.metoffice.gov.uk/weather/learn-about/weather/atmosphere/north-atlantic-oscillation

2. Recent Climatology
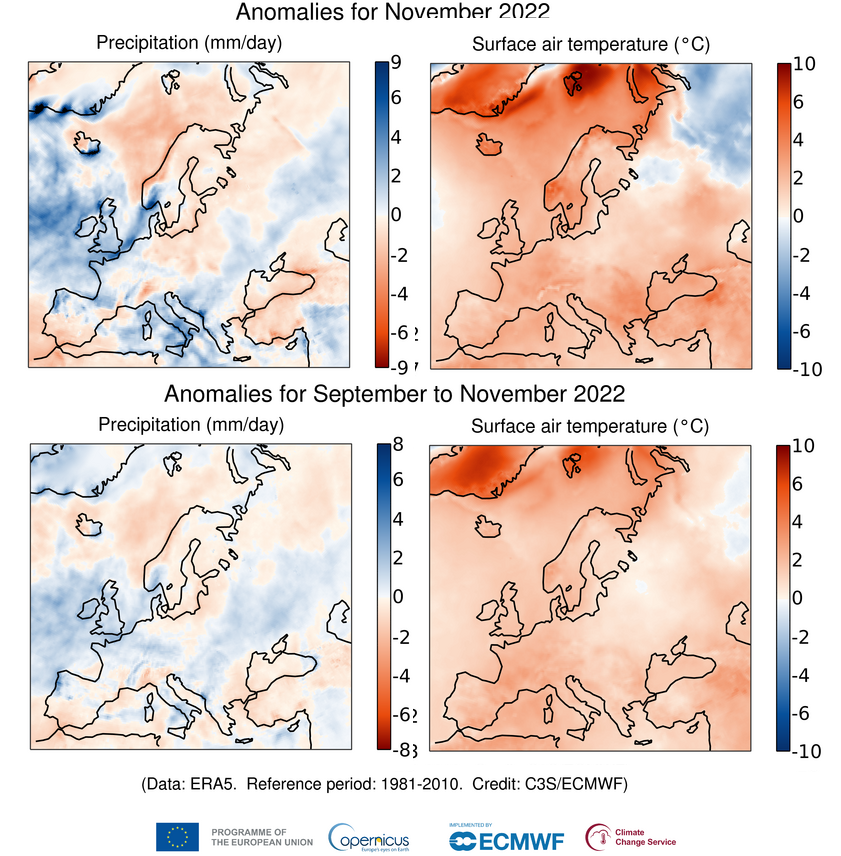
Recent WMO publication “State of the Climate in Europe 2022” shows how Europe has been warming twice as much as the global average since the 1980s, with far-reaching impacts on the region’s socio-economic fabric and ecosystems. In 2022, Europe was approximately 2.3 °C above the pre-industrial (1850-1900) average used as a baseline for the Paris Agreement on climate change.
SW England
June to the 19th the average temperature was between 16 and 18 Celsius, that’s 2 to 3 degrees Celsius above average. Rainfall was largely below 10mm in most places but overnight rain 19/20th and heavy thundery showers across northern parts of SW England will have locally increased totals.

UK:
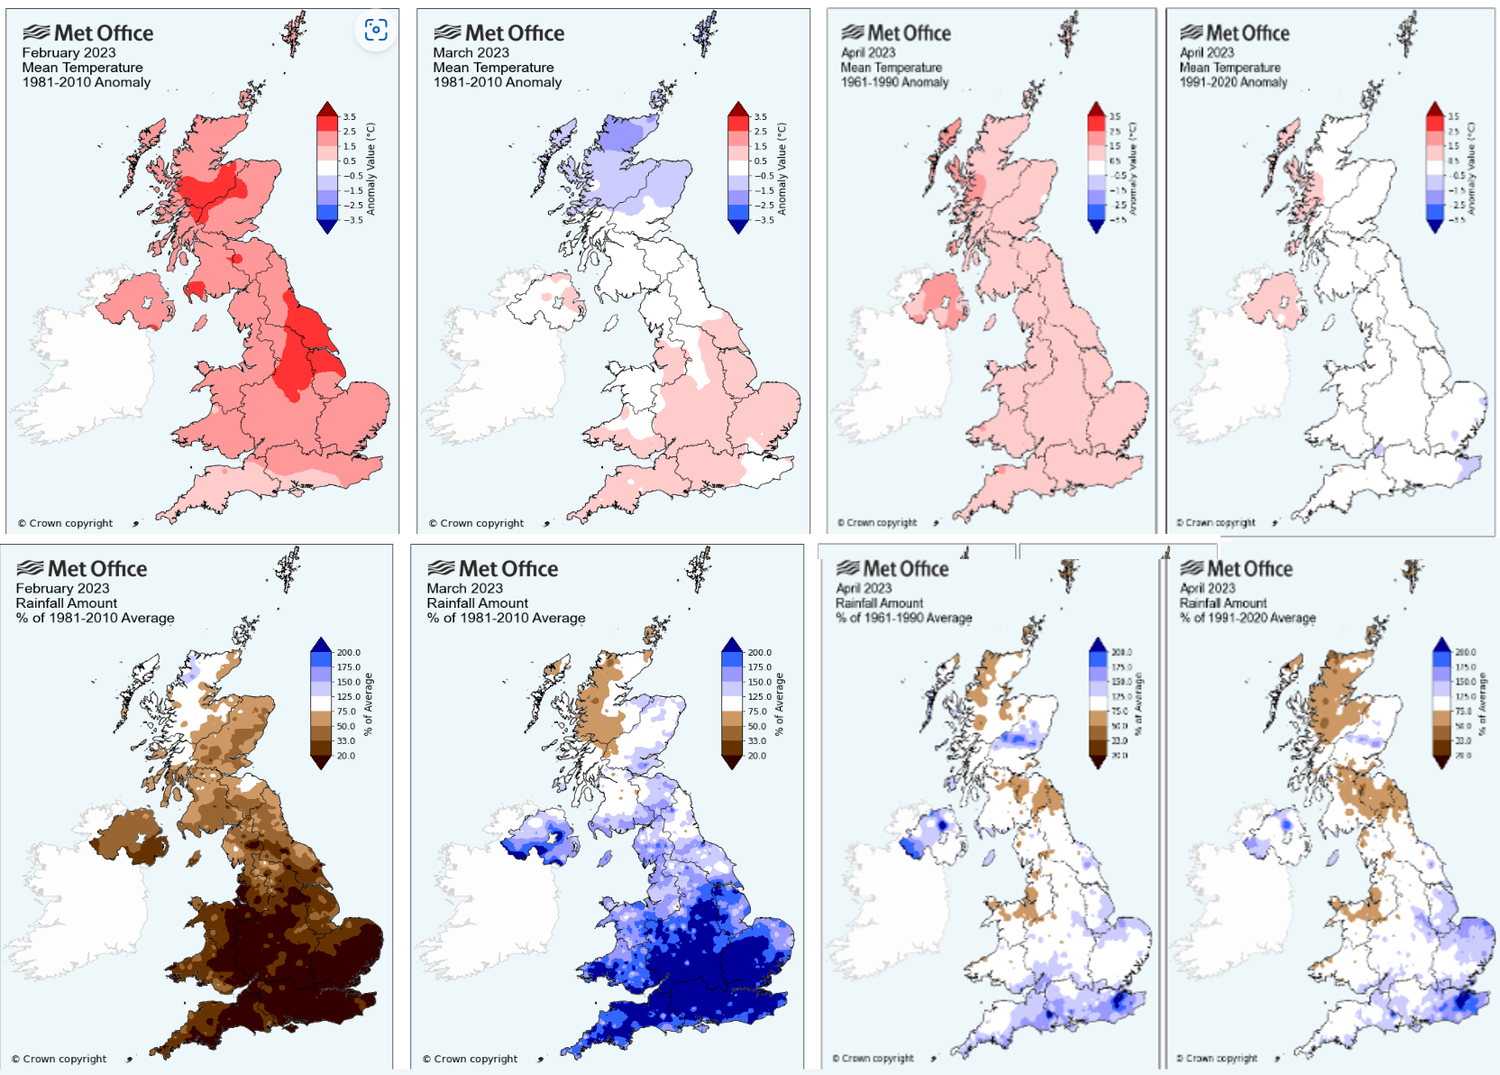
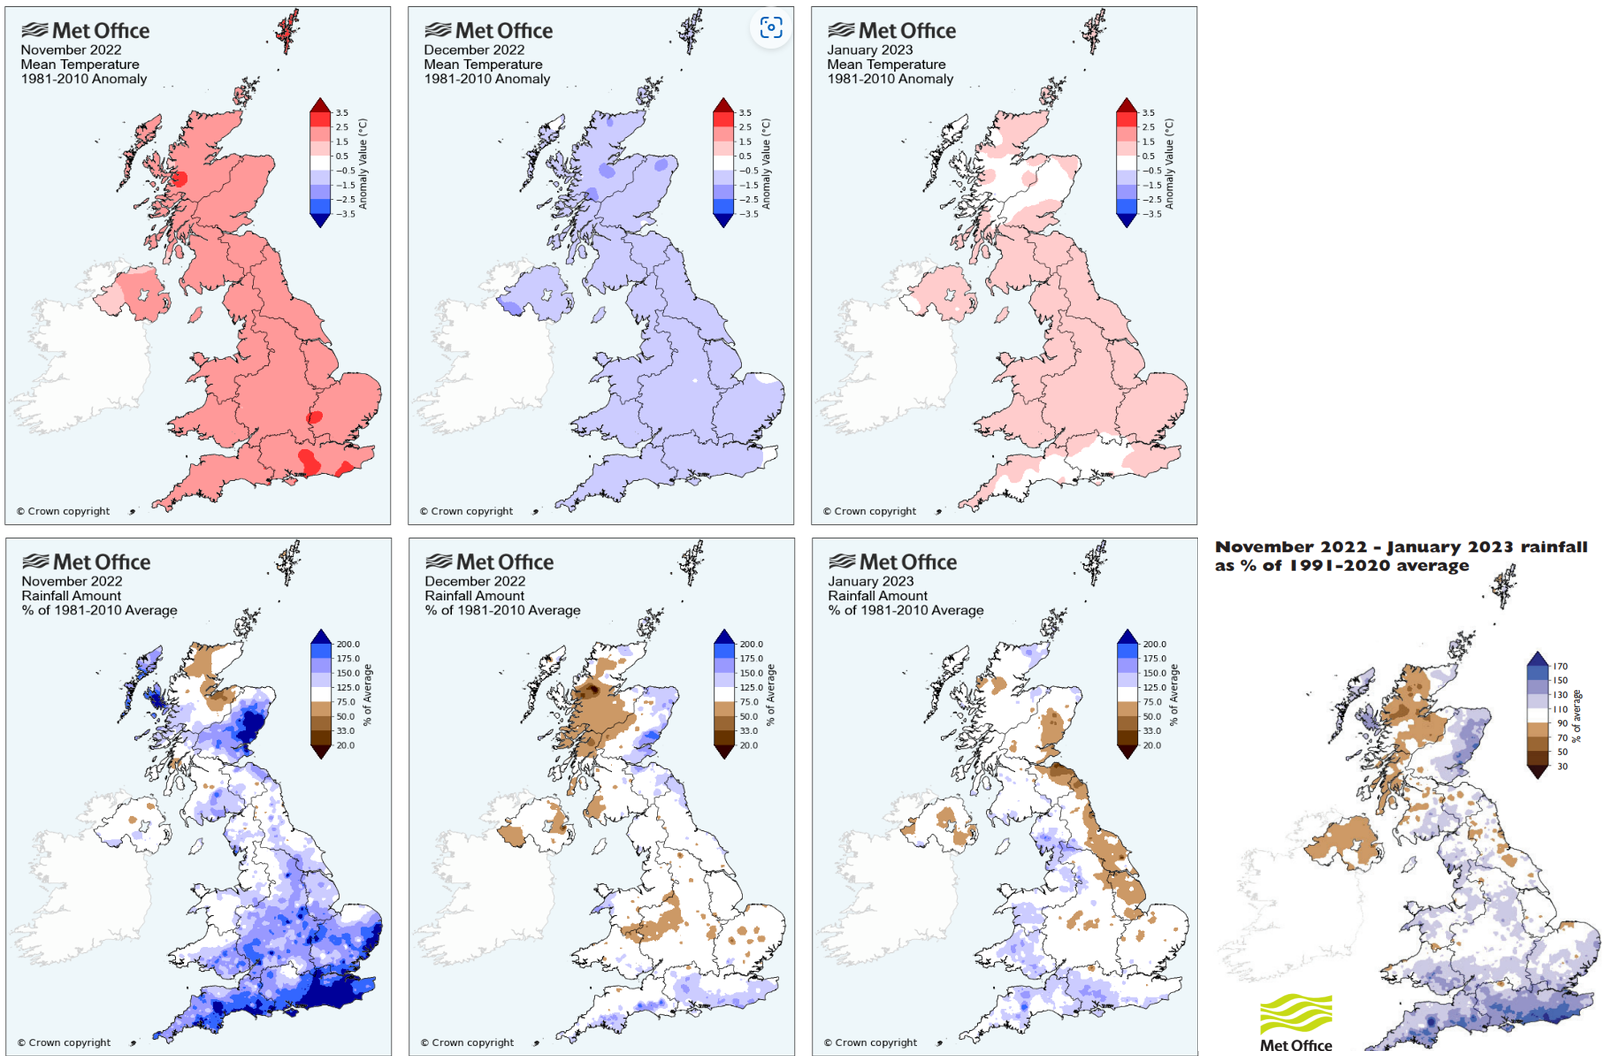
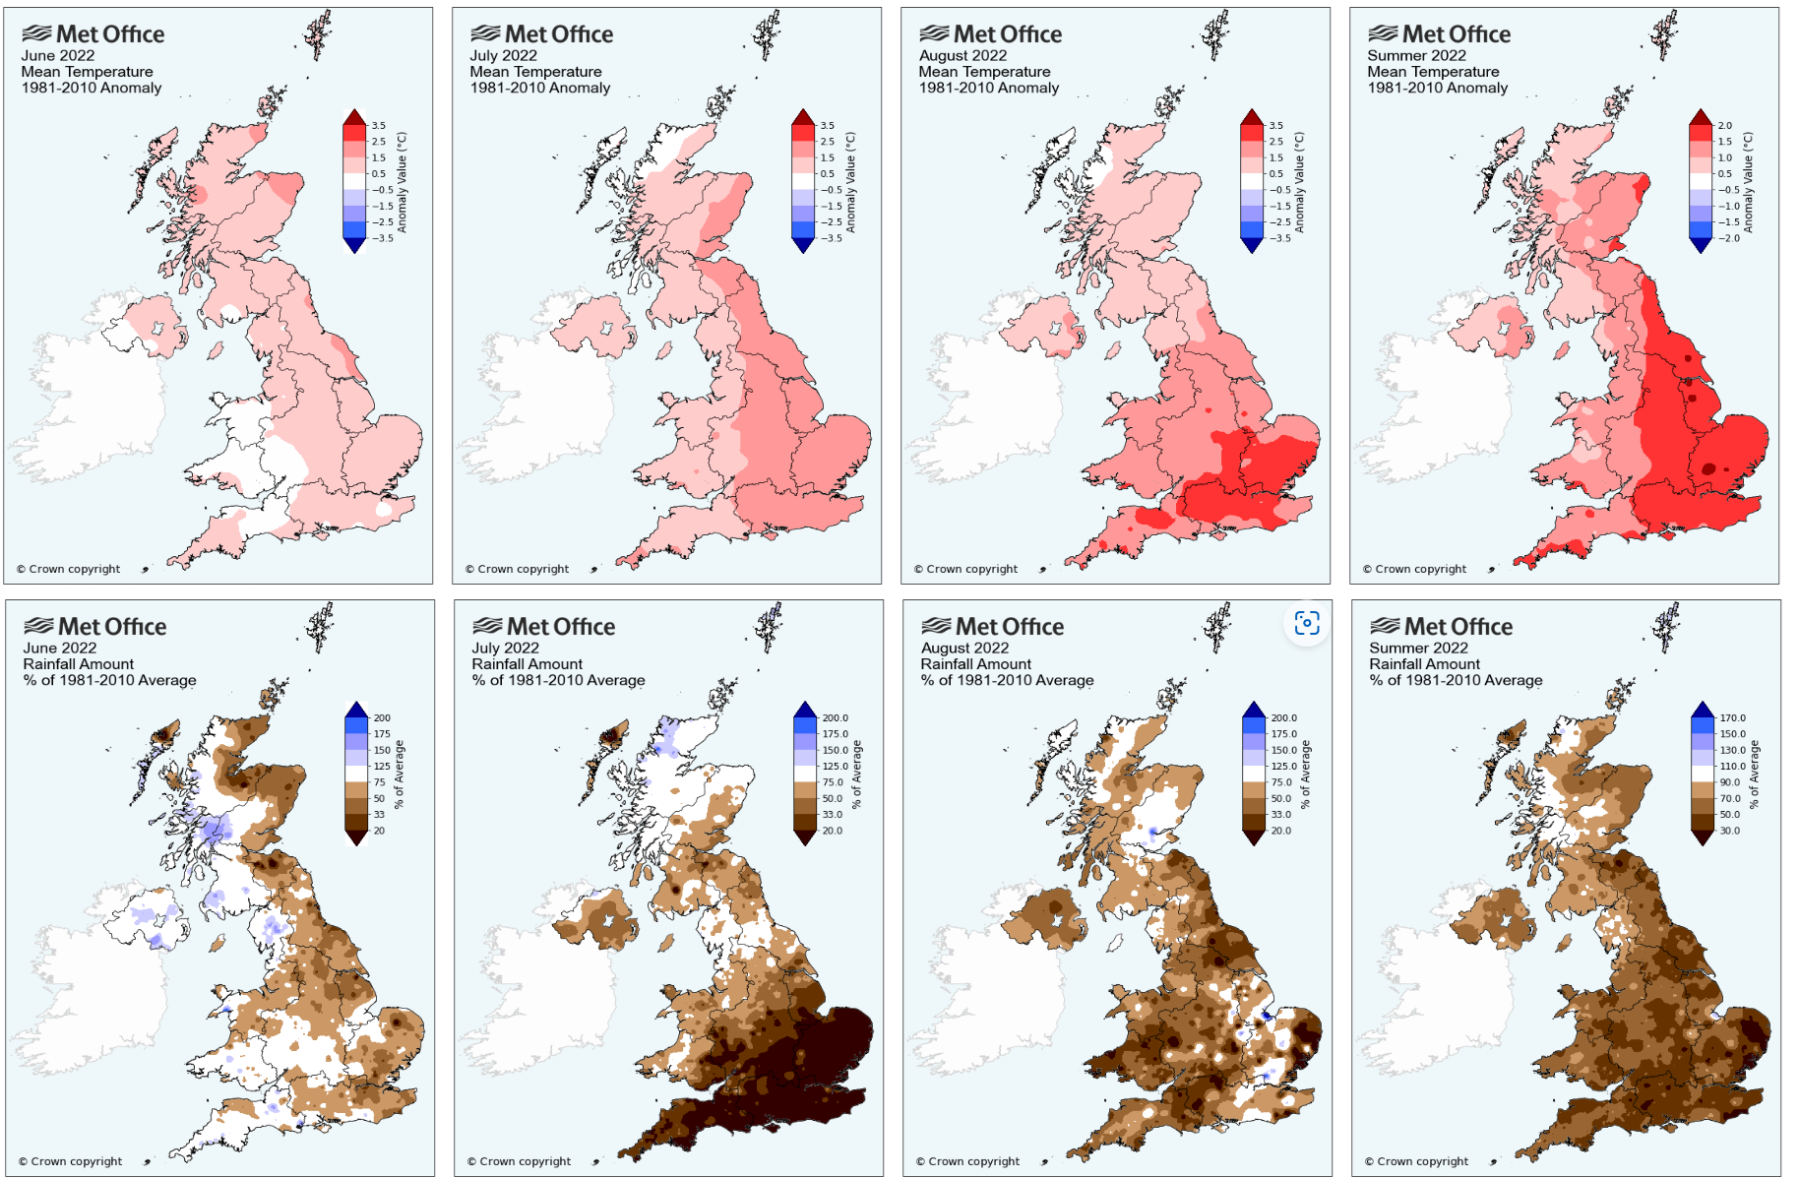
Met Office provisional Temperature and Rainfall anomalies for 2023 March April May are shown below. Temperatures in most areas were above average. Rainfall was above average. in most places hence it is shocker that hosepipe bans are require although there has been climate data showing increased run off rather than retention of water in the soils.
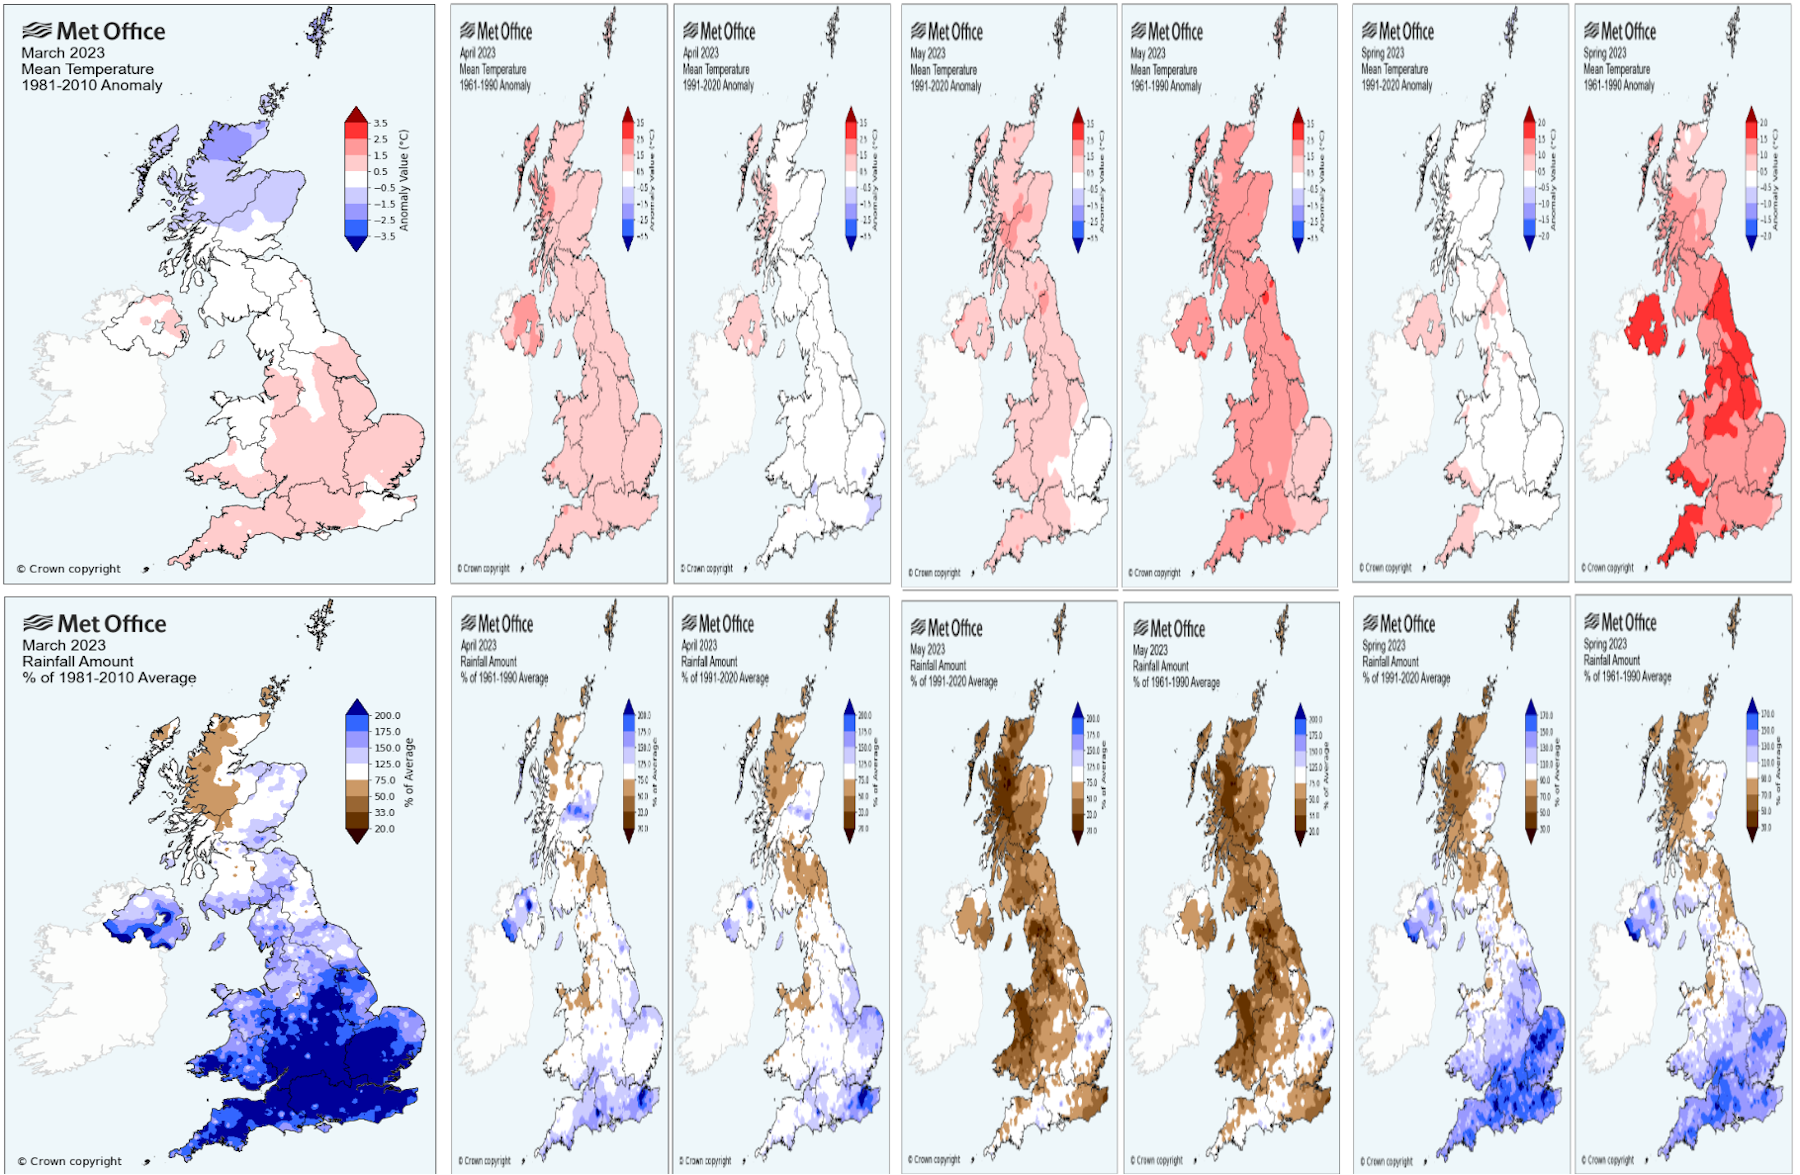
The 1981-2010 anomalies are no longer available on the Met Office site so will be using 1991-2020 graphics in future. Note that due to the rises in temperature decade on decade the April value shows as above average compared to 1961 to 1990 but near average when using the higher averages in the 30 years to 2020. Rainfall shows a similar trend suggesting rainfall amounts (30 year average) have increased decade on decade so that averages are higher and hence above average values harder to achieve at least early in the 30 year comparison period (assuming increases continue).
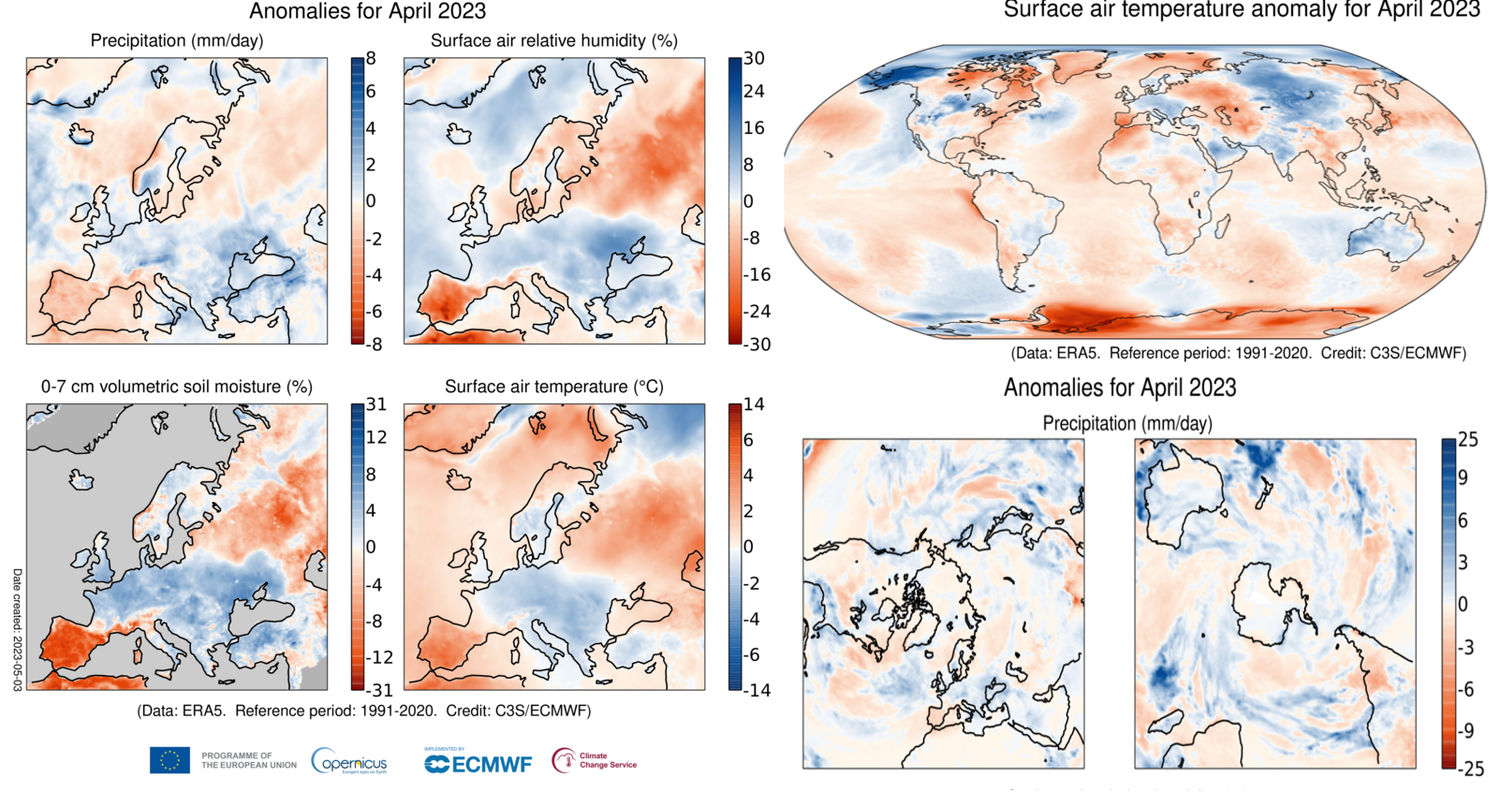
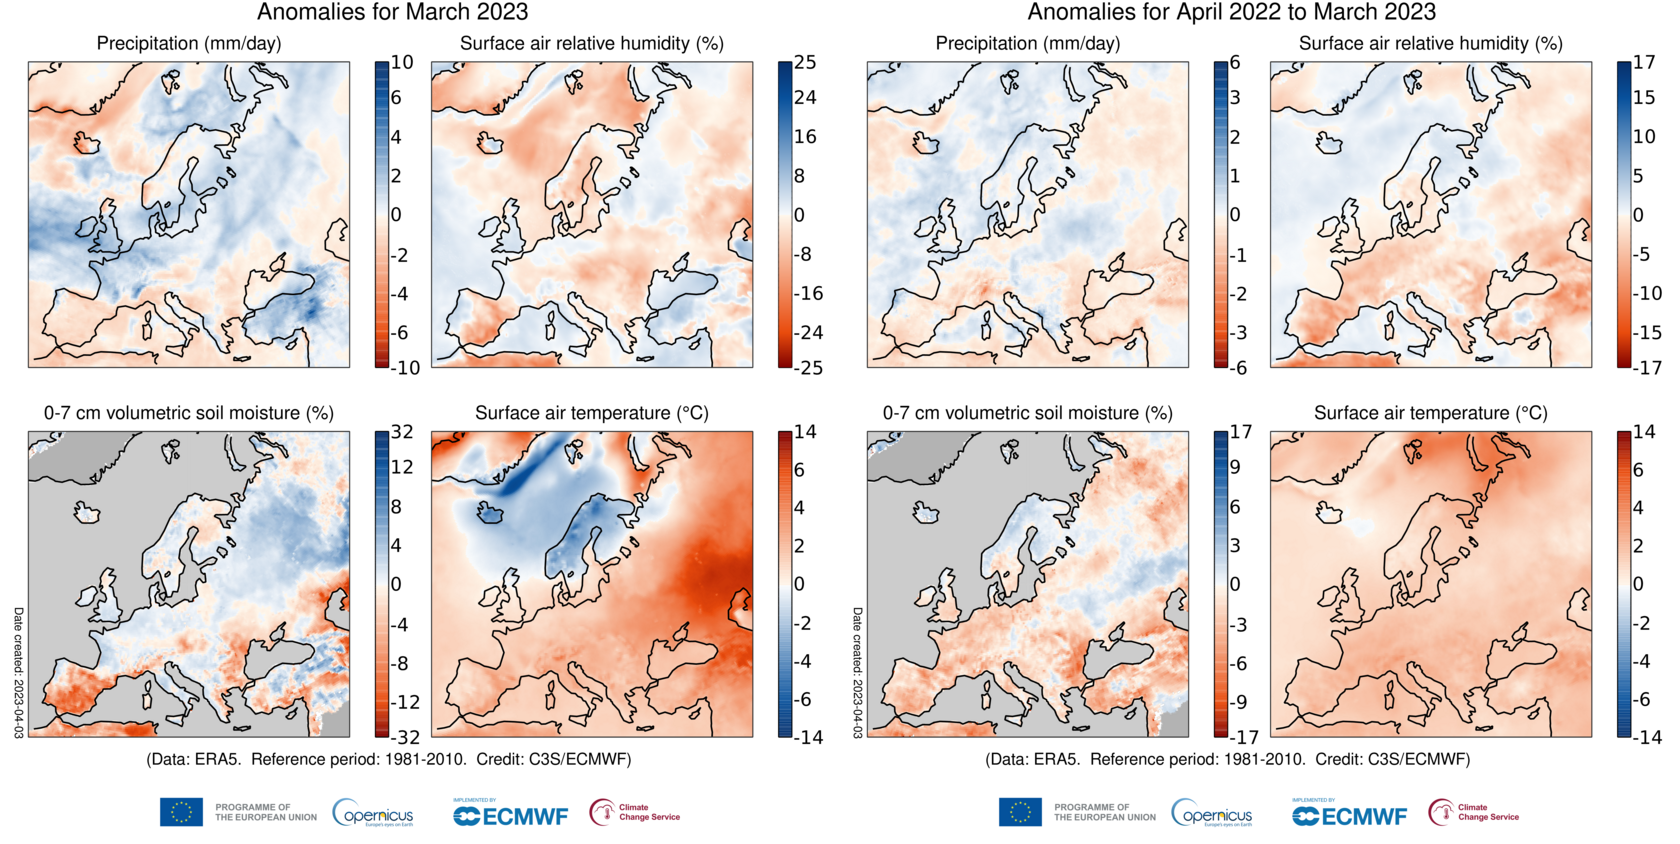
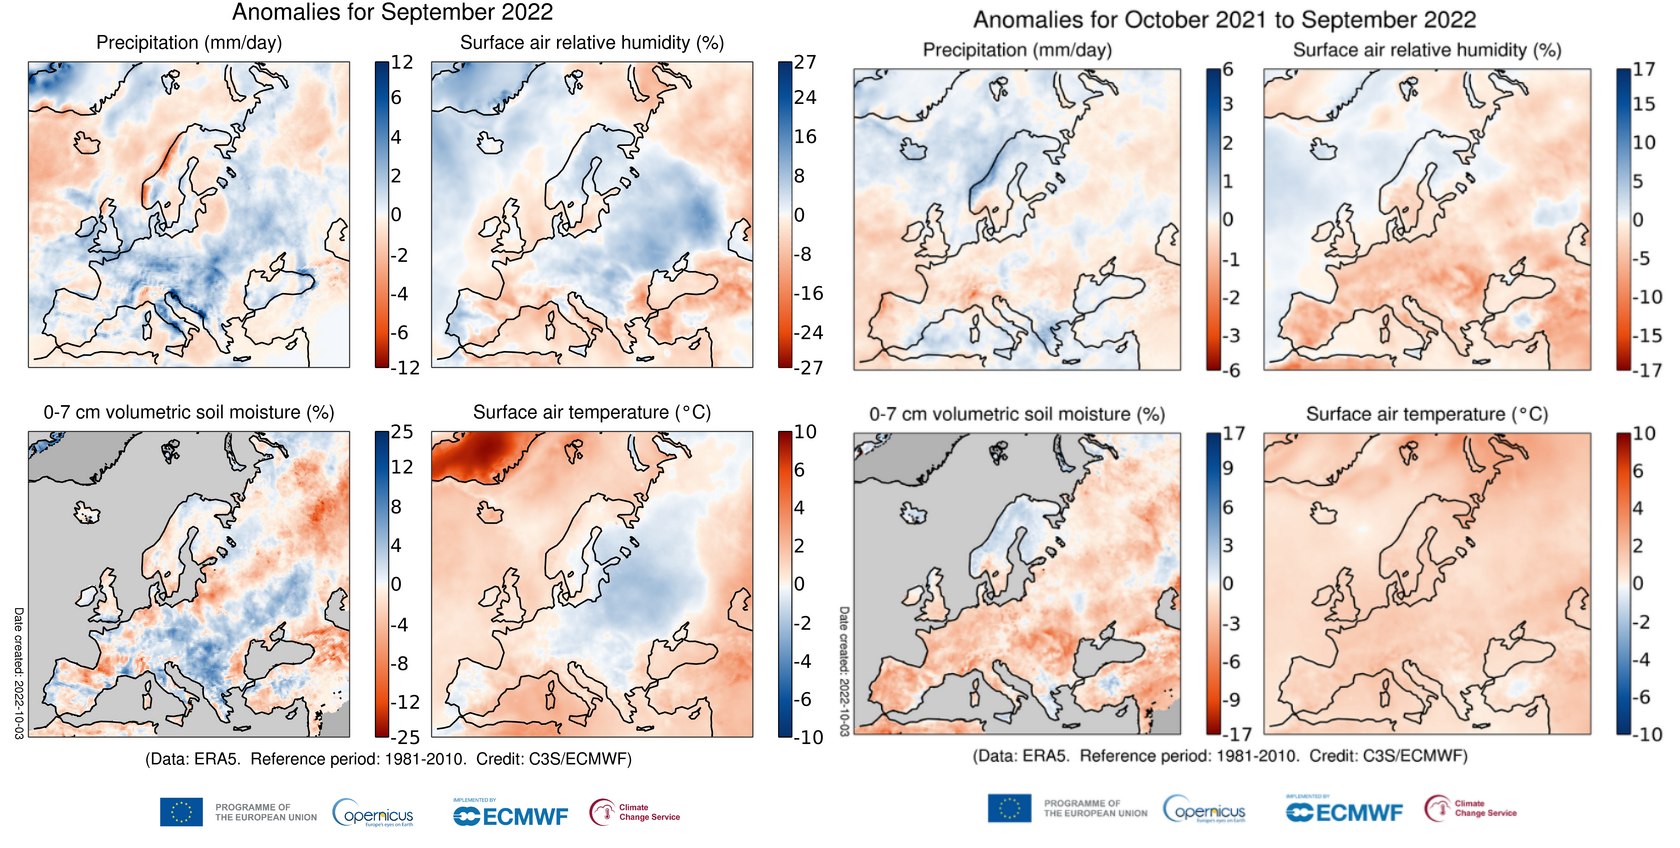
Copernicus, European sourced temperature and rainfall anomalies for May 2023 and the 12 months to the end of May compared with the 30 year period 1991-2020, are shown below:

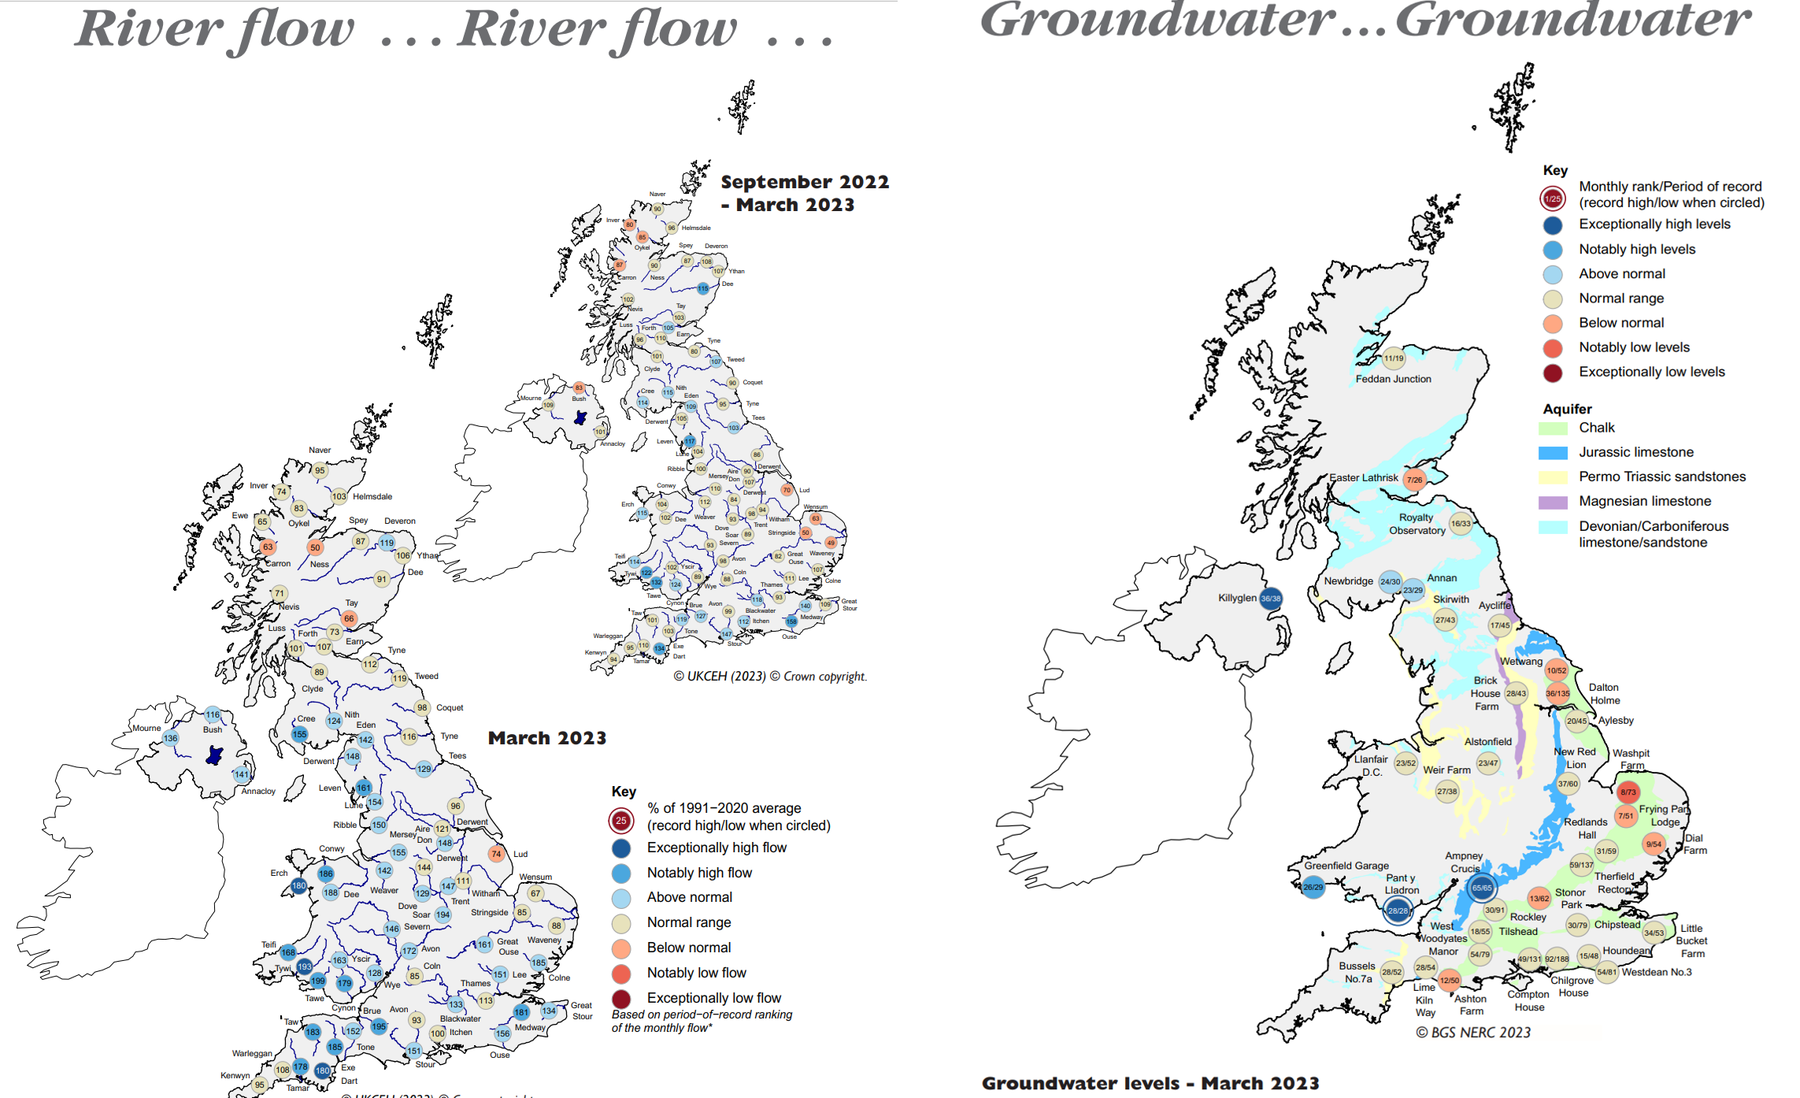
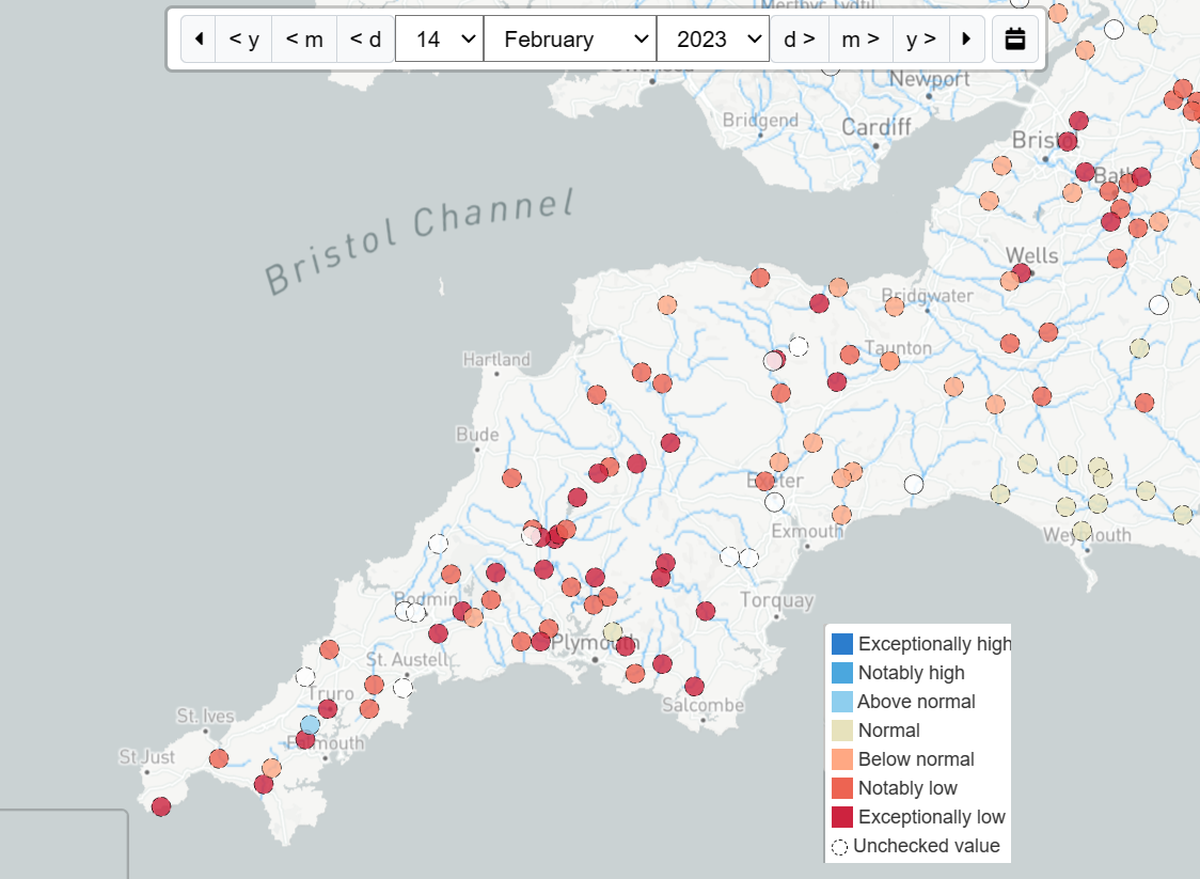
UK River flows and ground water levels in May 2023 can be found in the 2023 Hydrological Summary

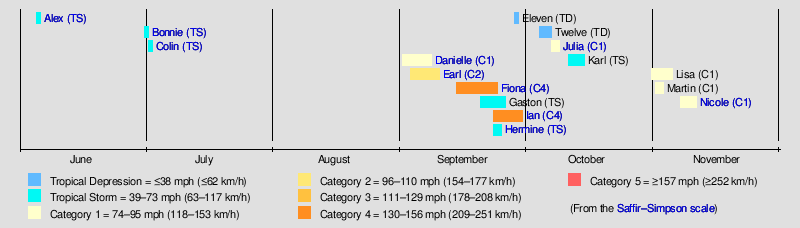
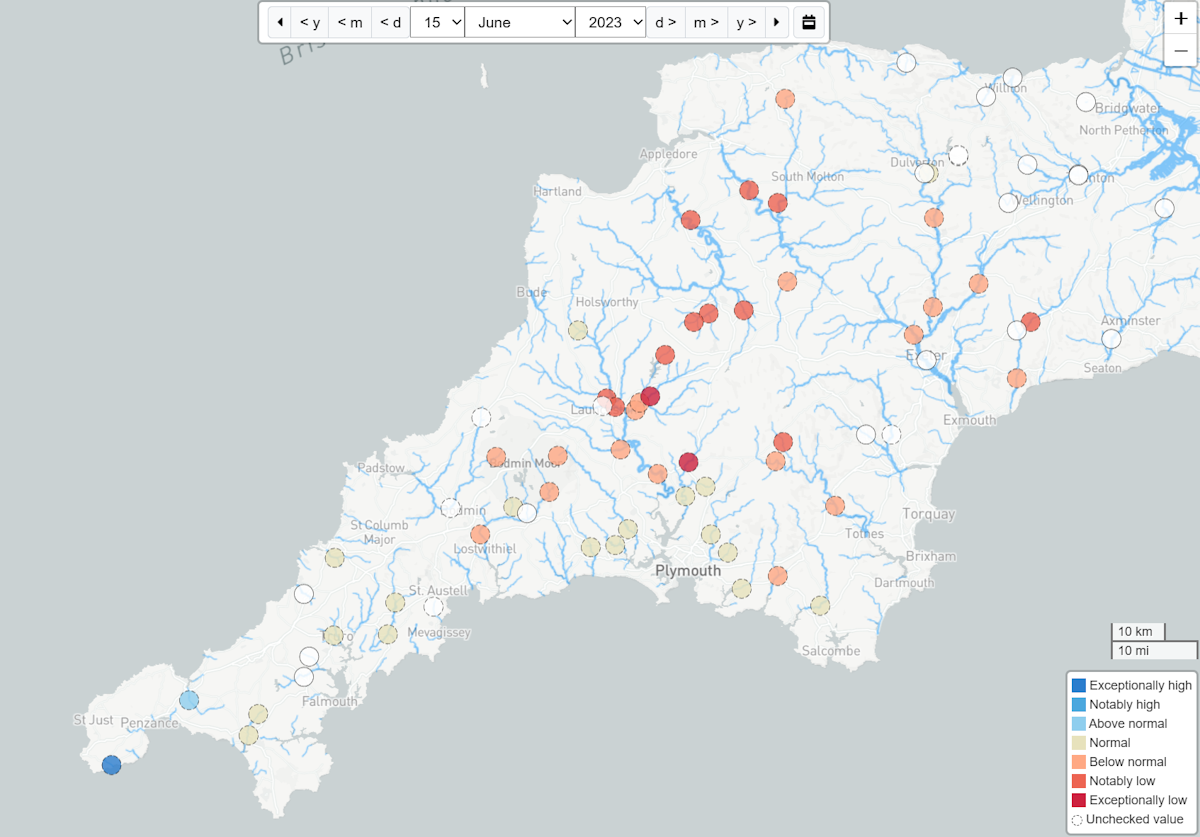
River flow across SW England were above average in May 2023. River flow data for the 15th of June from the UK Water Resources Portal shows well below normal river flows following the recent dry and hot weather.
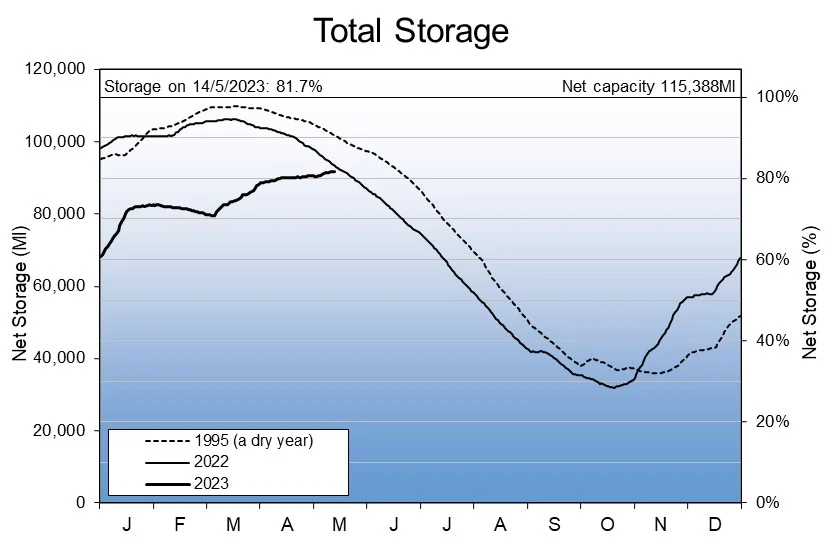
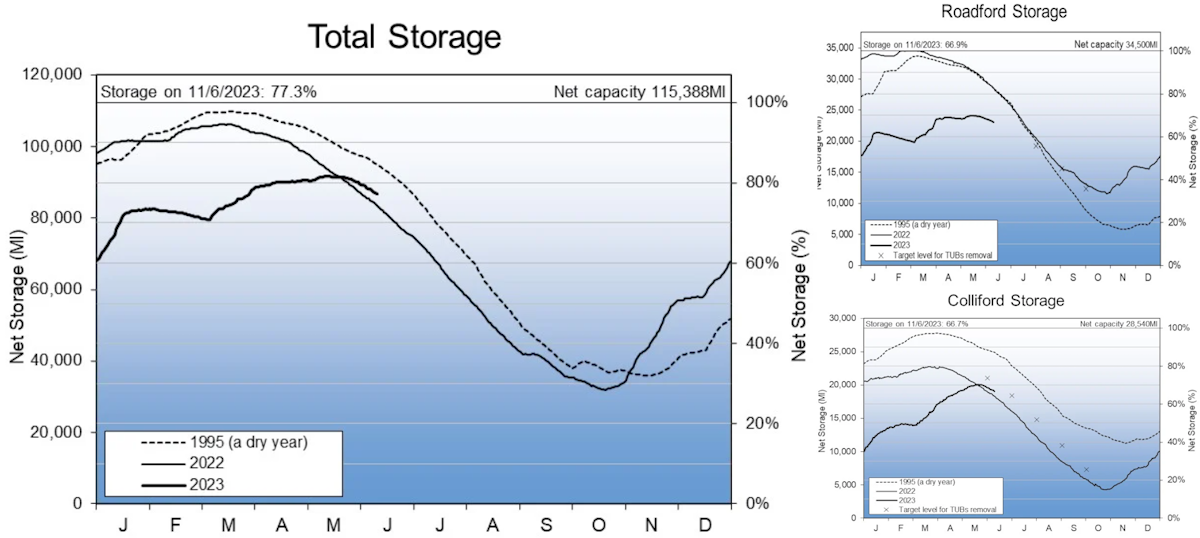
Reservoir levels, according to SW Water remain below the long term average across SW England as of 15th June 2023 mainly due to Colliford and Roadford being only 70% full despite above average rainfall over Winter and Spring!. Consequently hosepipe bans remain in force across Cornwall and much of Devon.
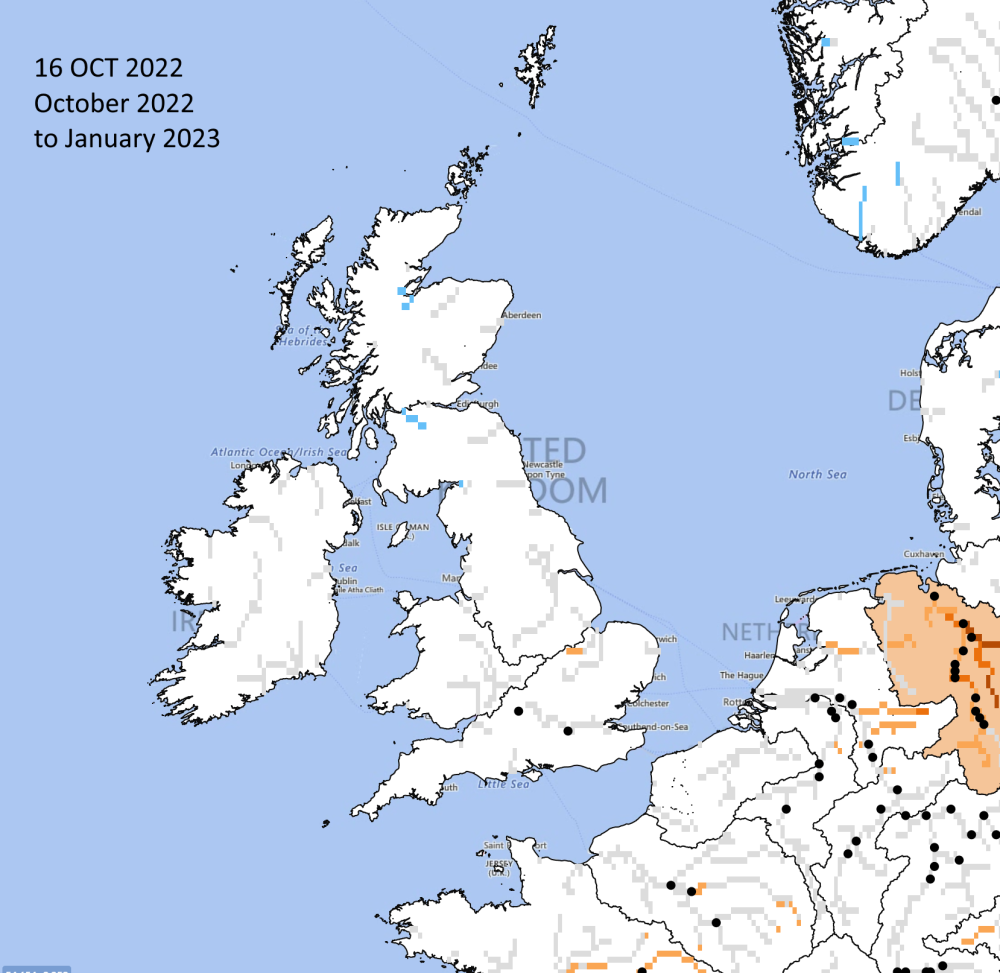
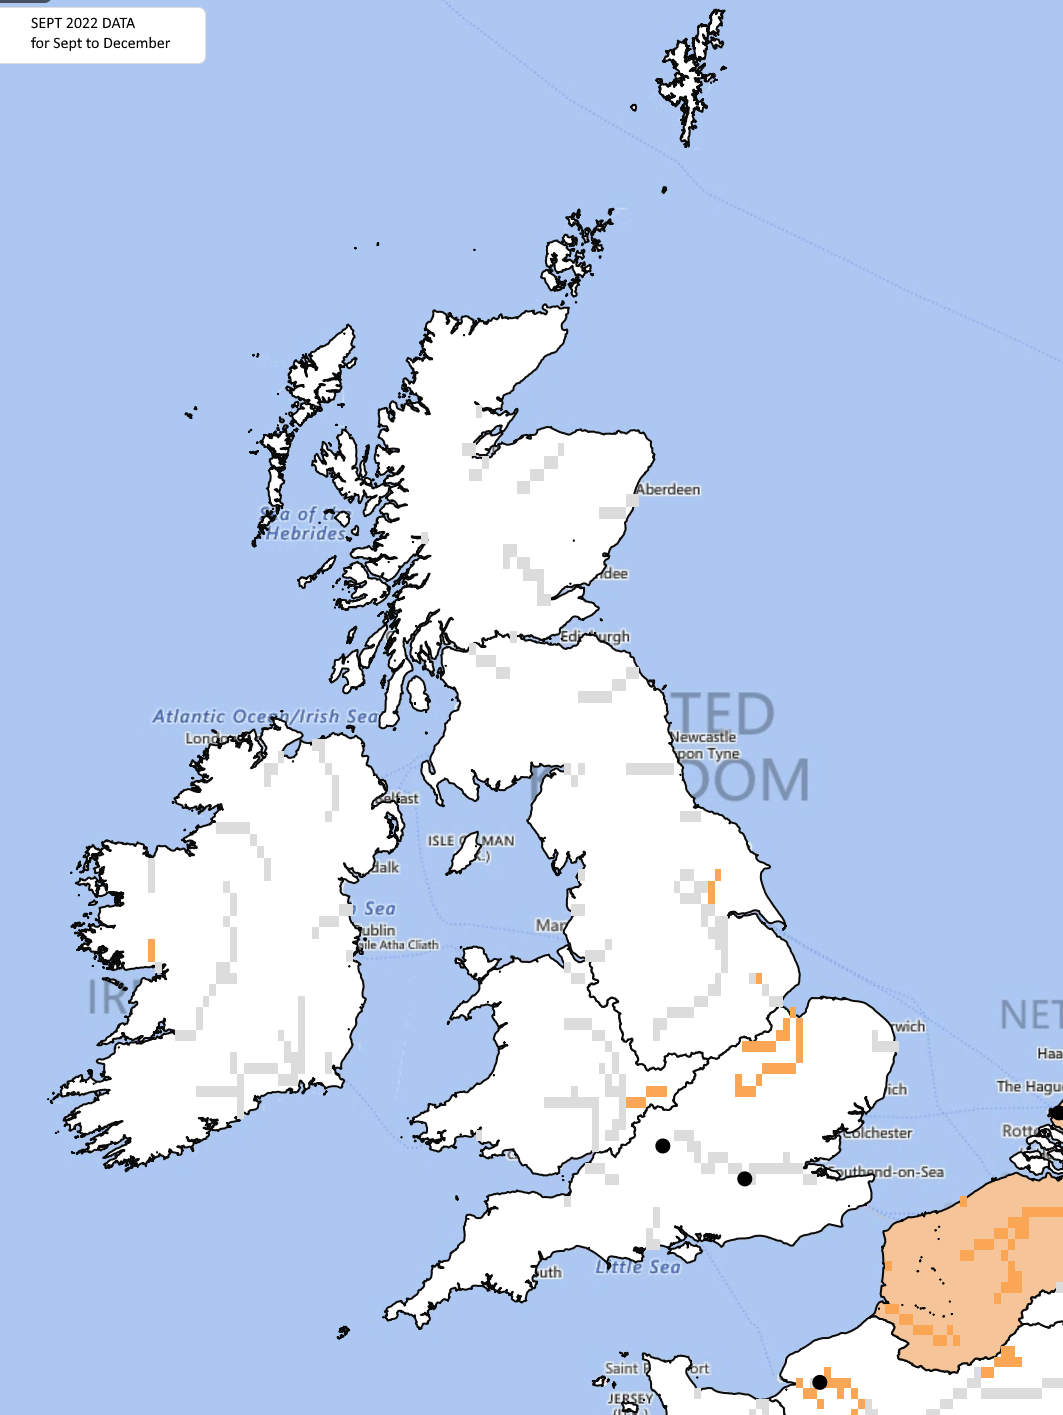
The Global Flood Awareness System – GloFAS – forecast from June 1st to end of September 2023 shows a “normal” flood risk across SW England – does not cover flash flooding from for example thunderstorms.

B: Forecast data:
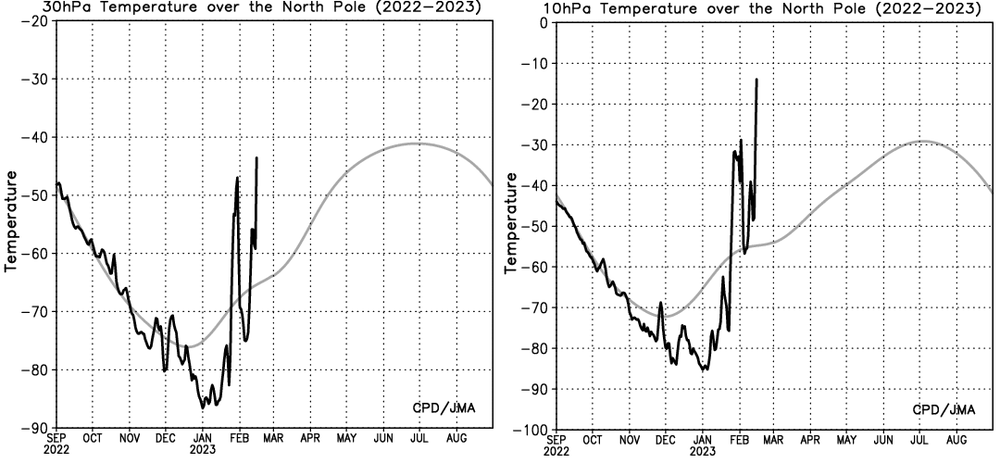
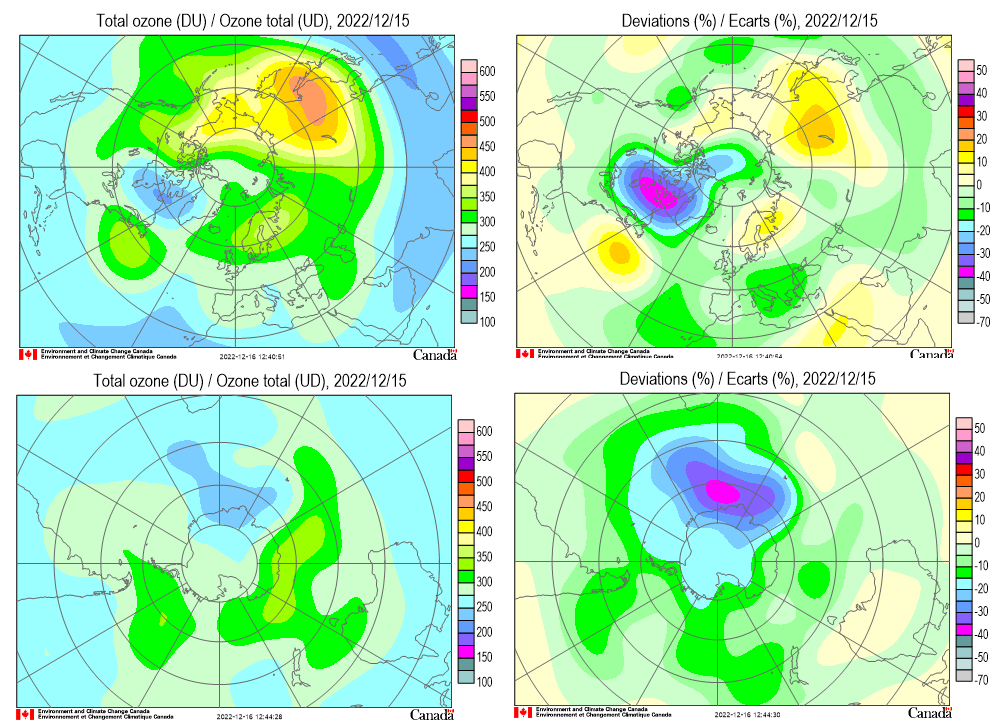
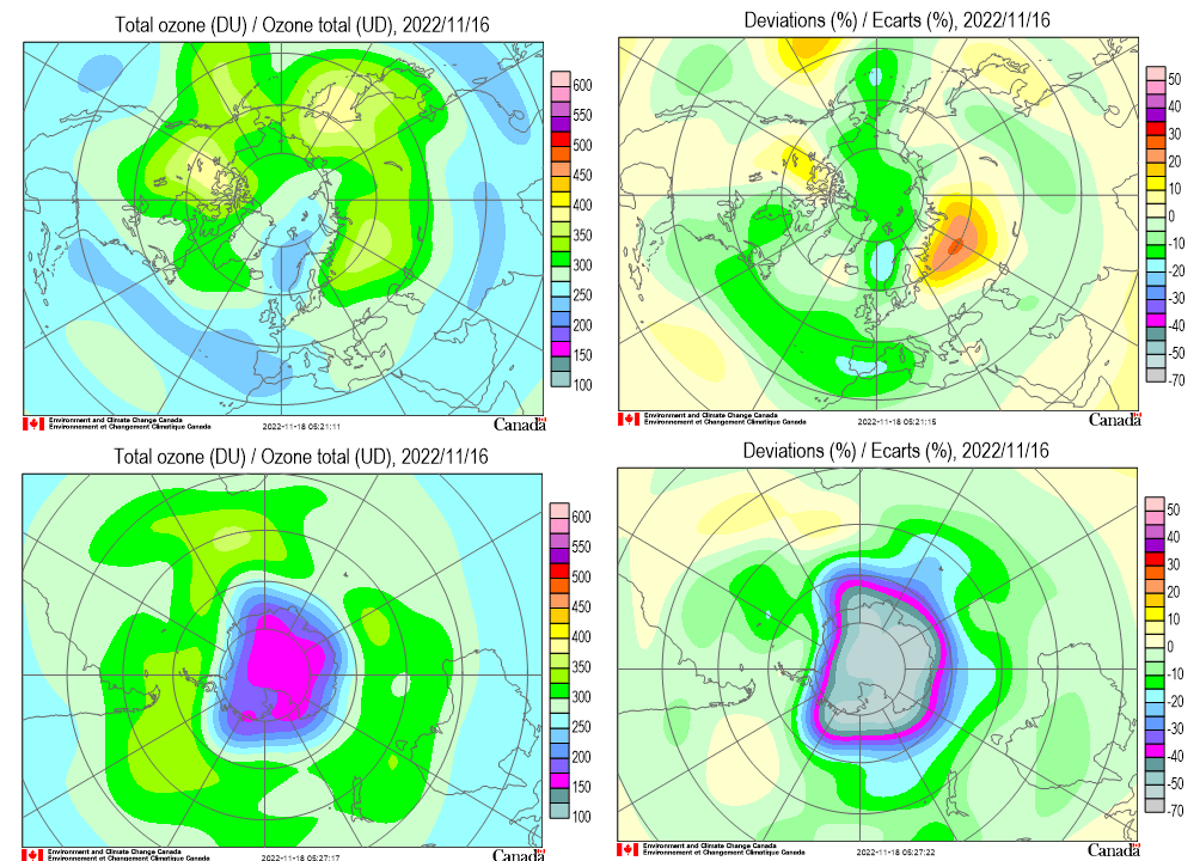
1. Stratosphere:
The polar vortex remains in summer mode as shown by the GFS 19/0600UTC analysis at 10hPa

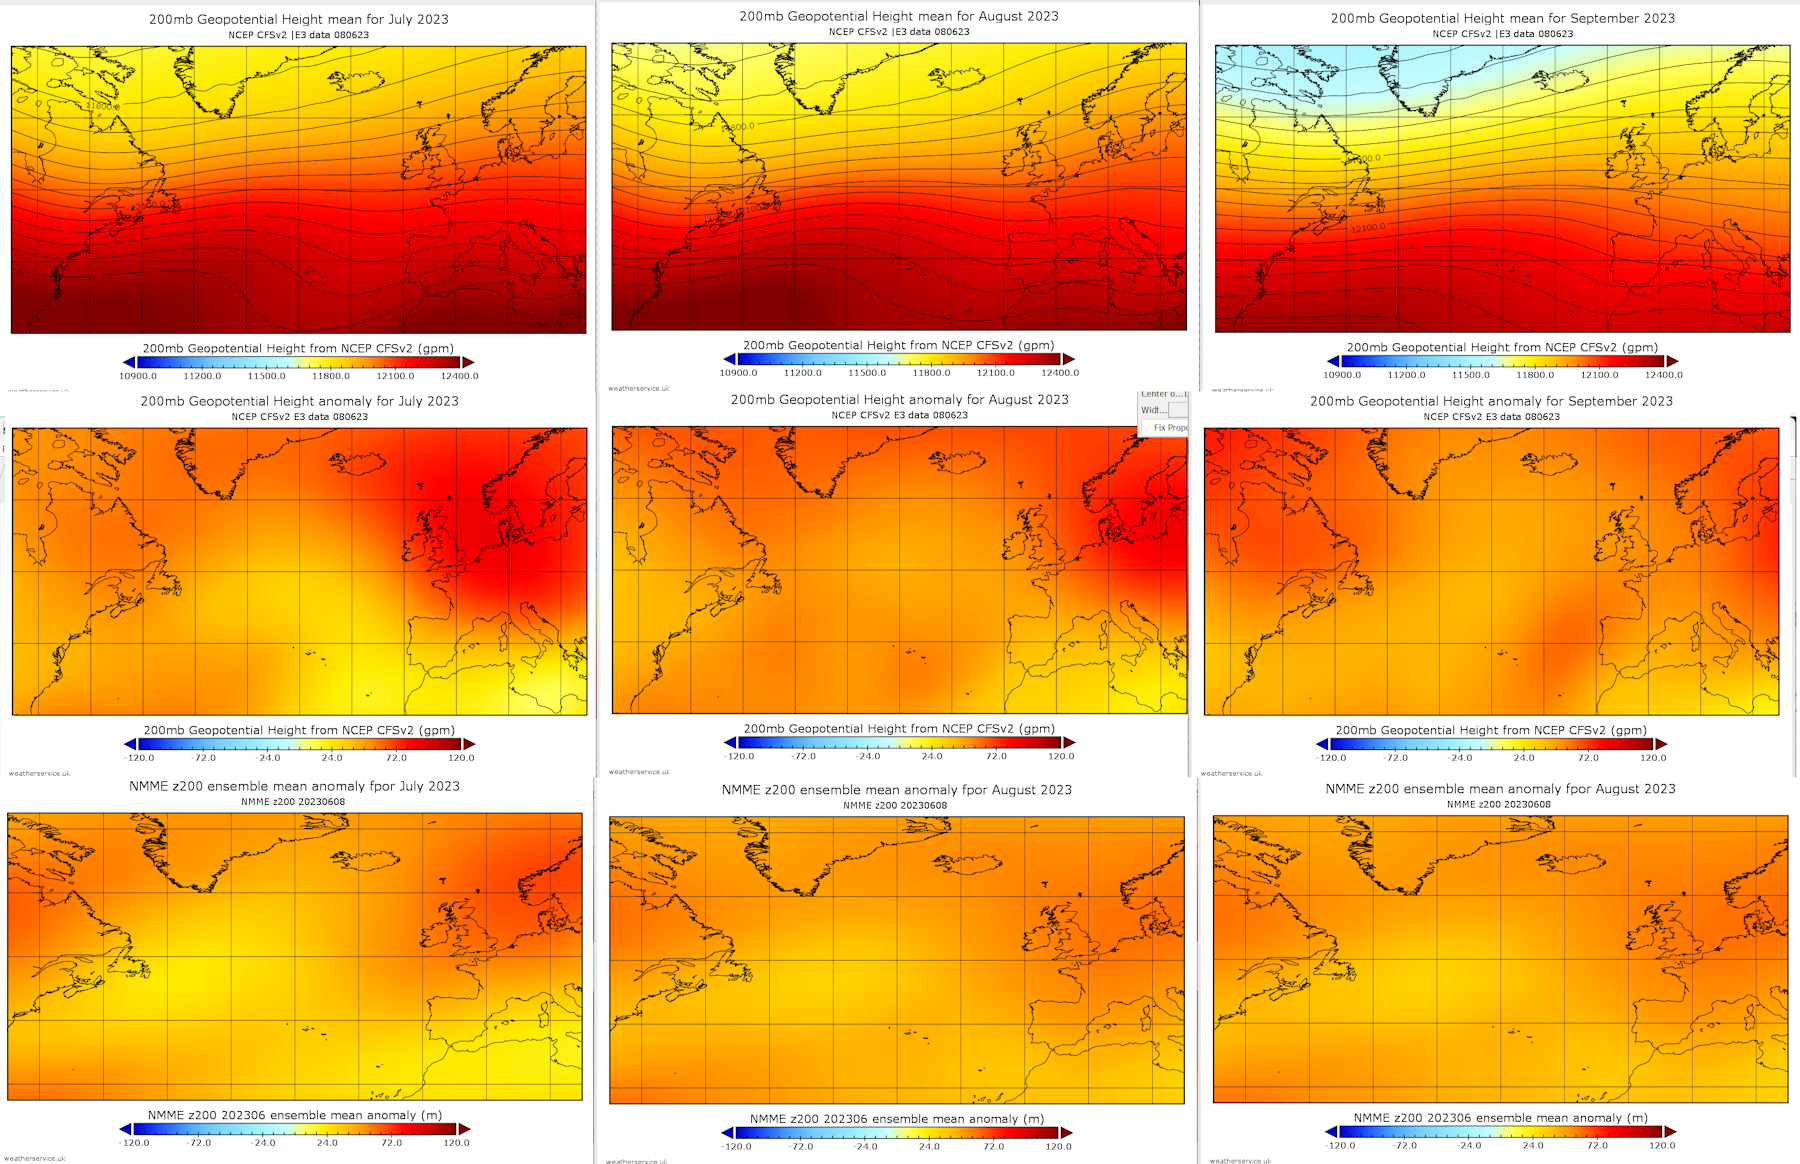
2. Upper troposphere:
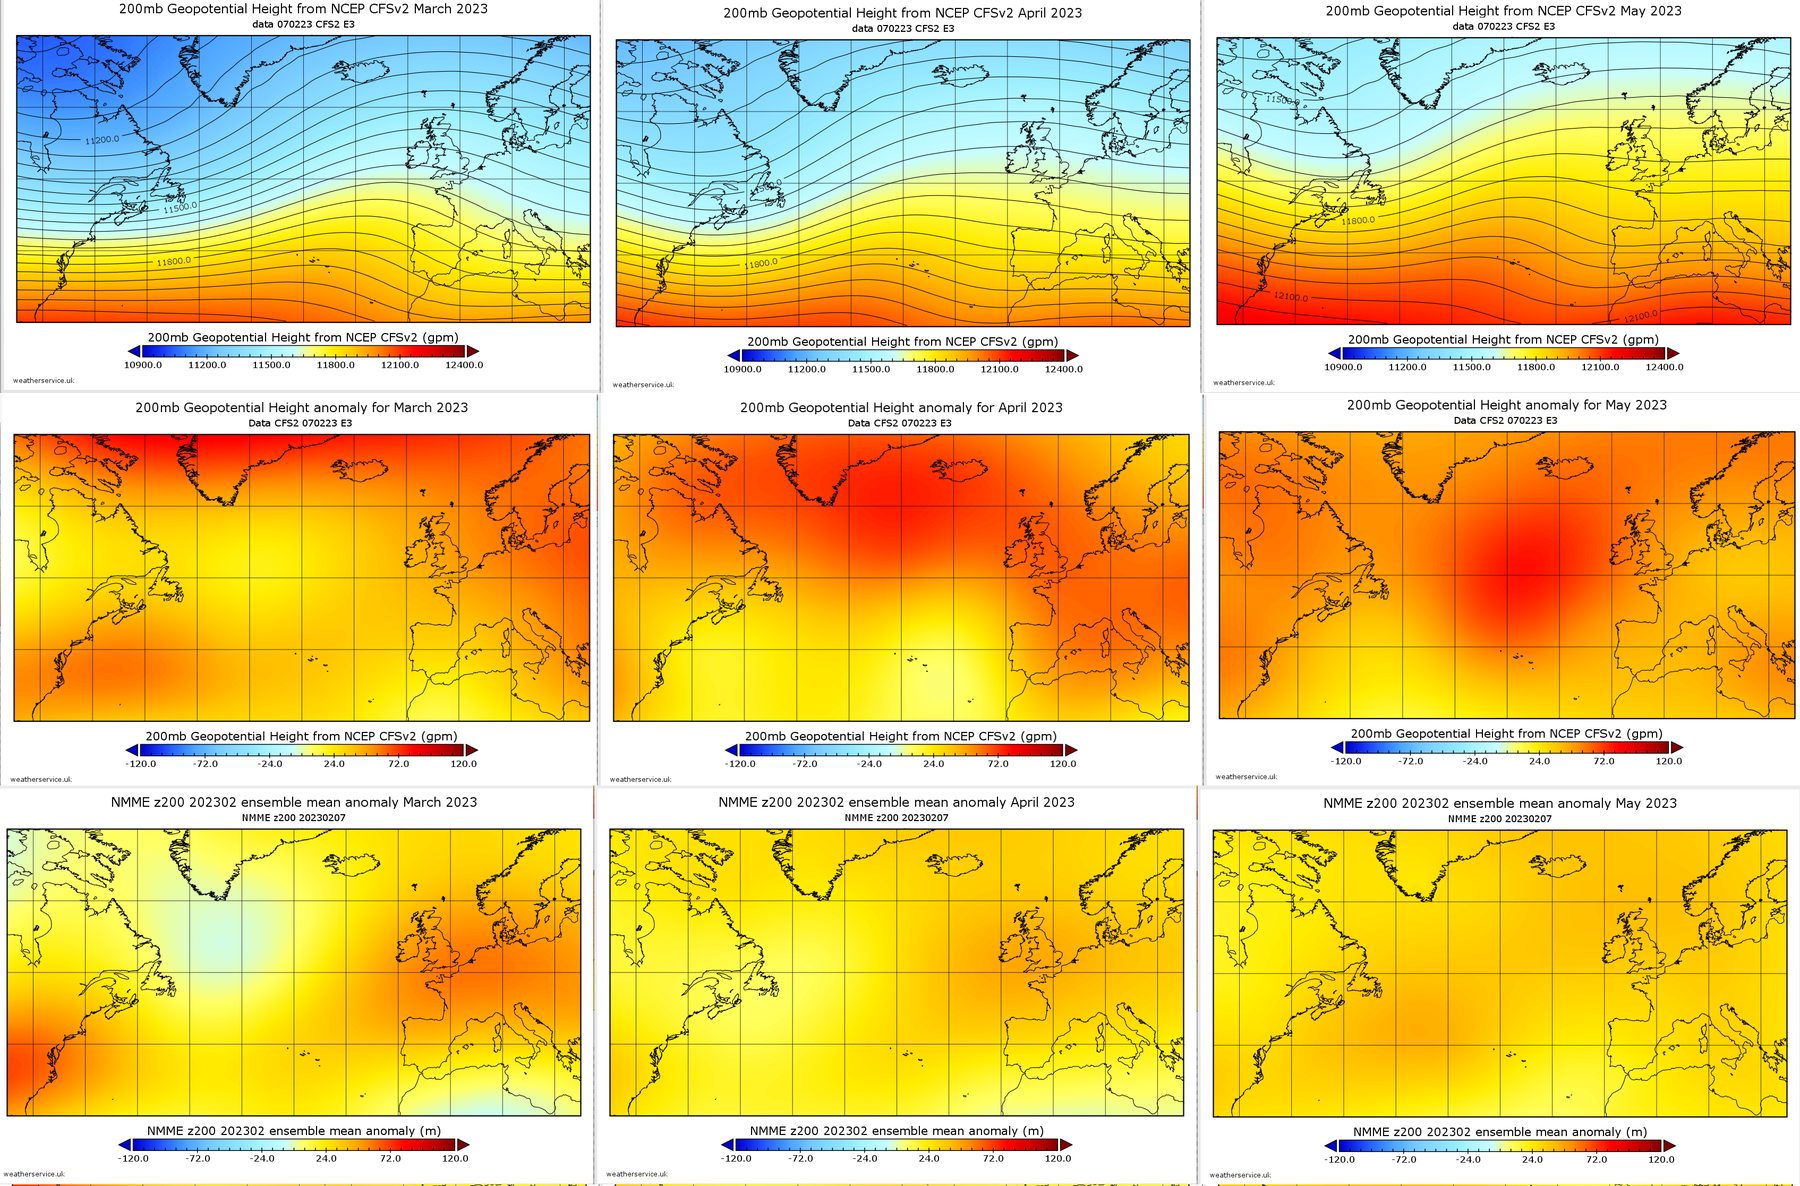
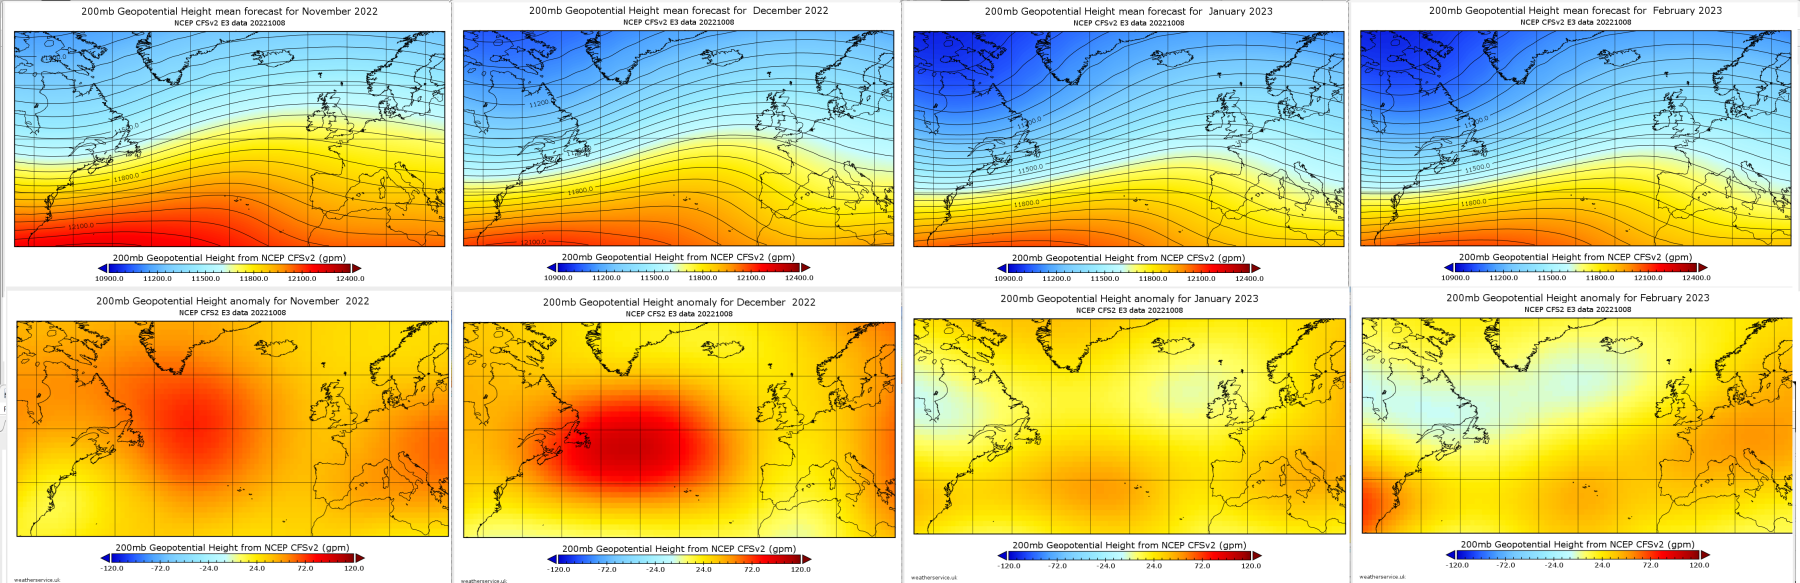
CFSv2 200hPa contours (top row) and CFSv2 anomaly (lower row) for July August September 2023.
3. Lower Troposphere:
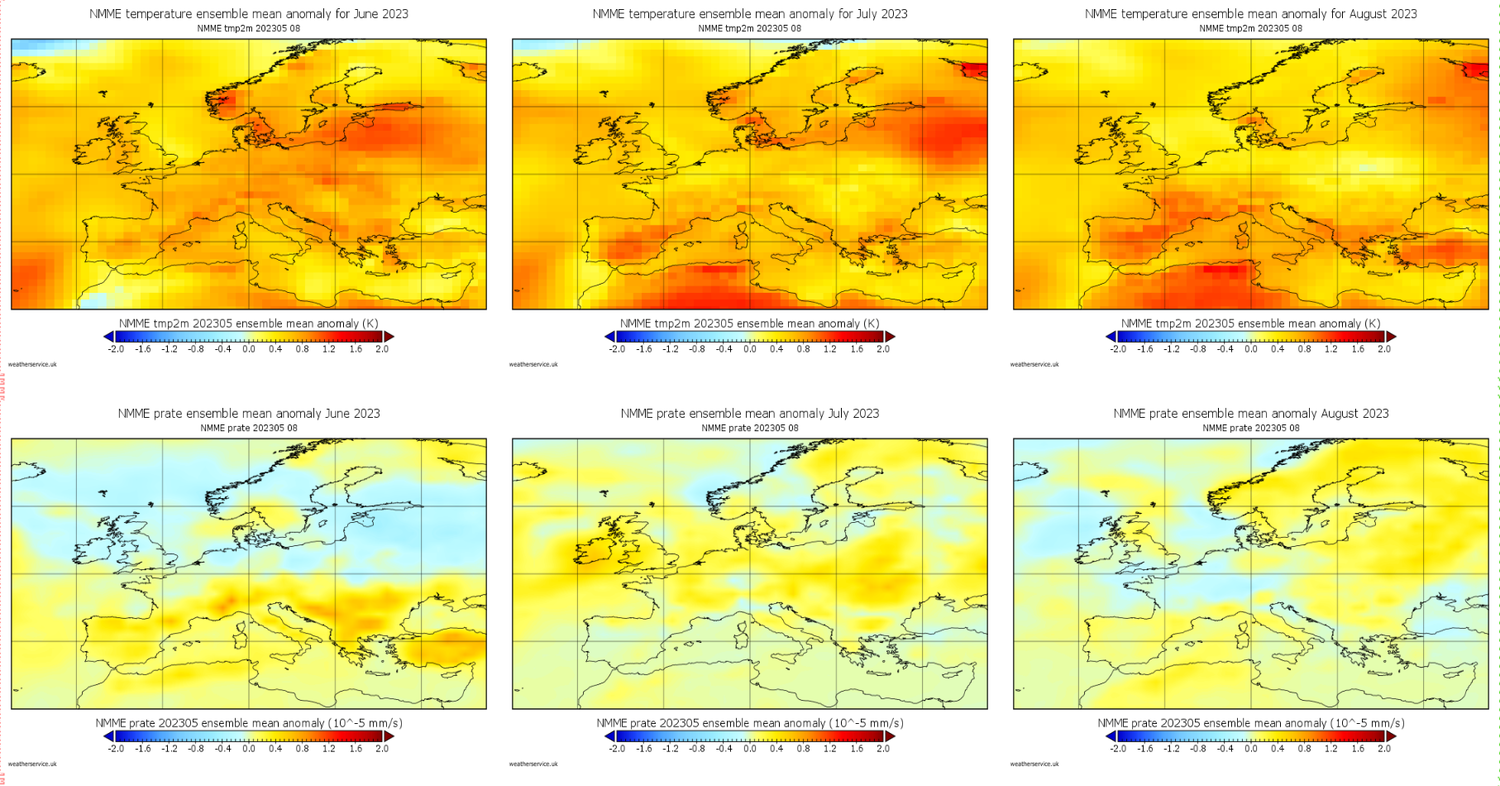
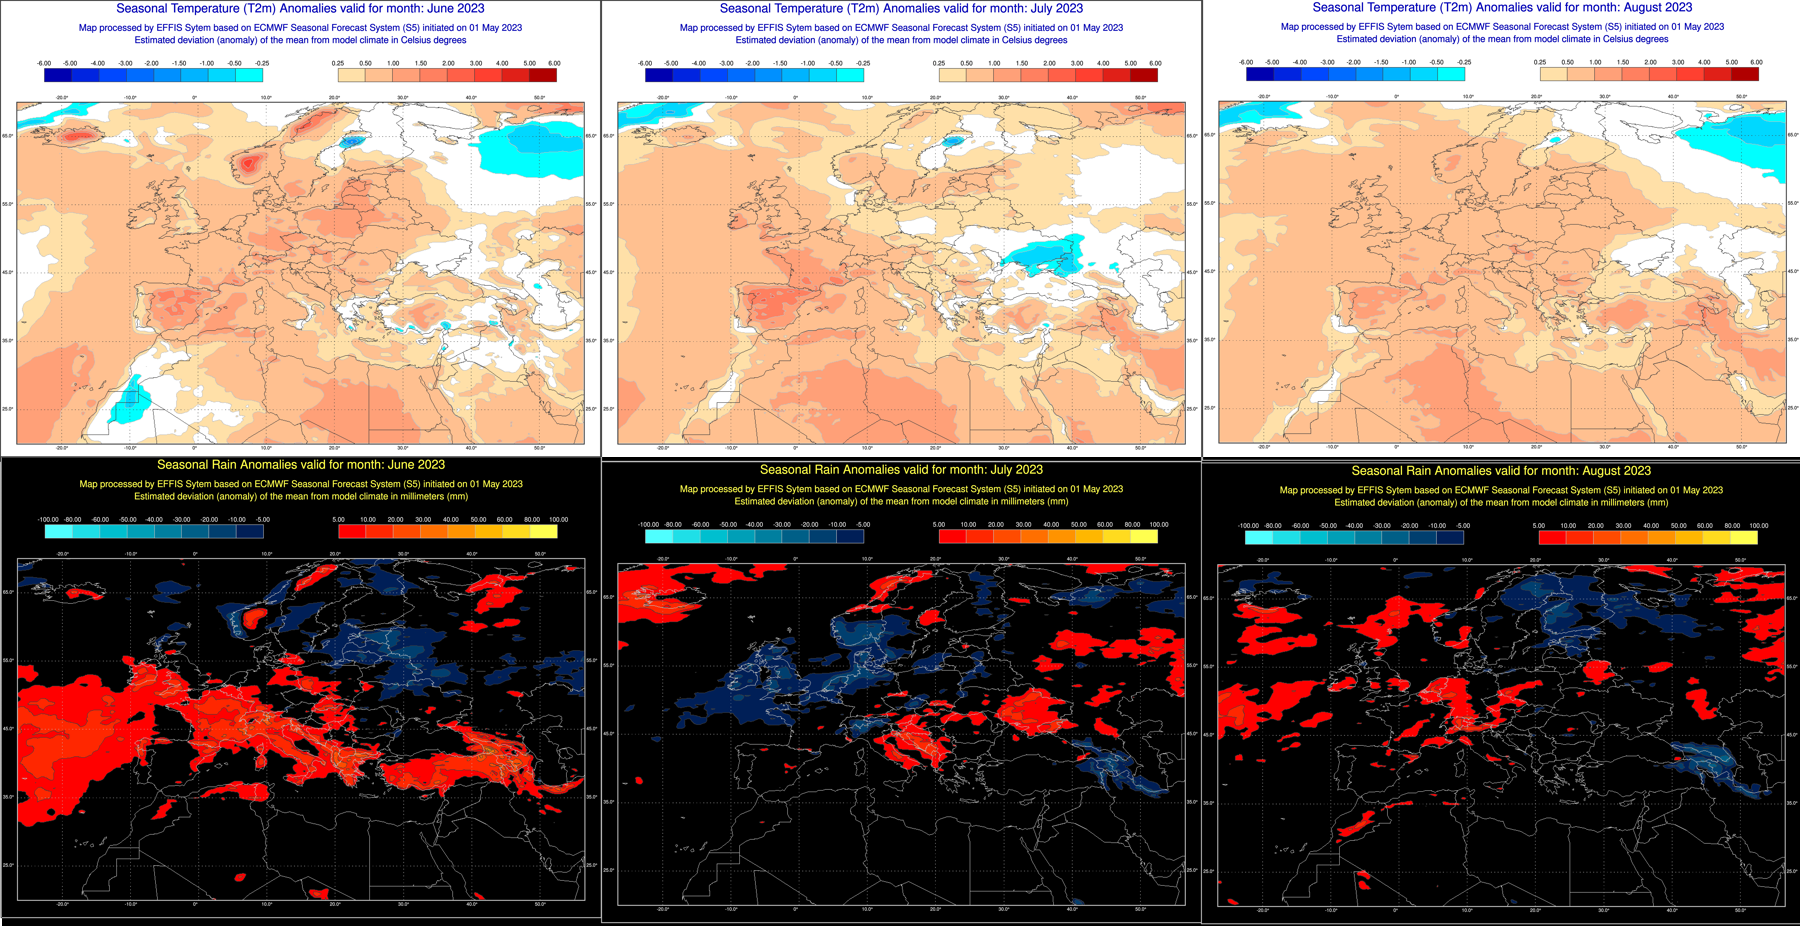
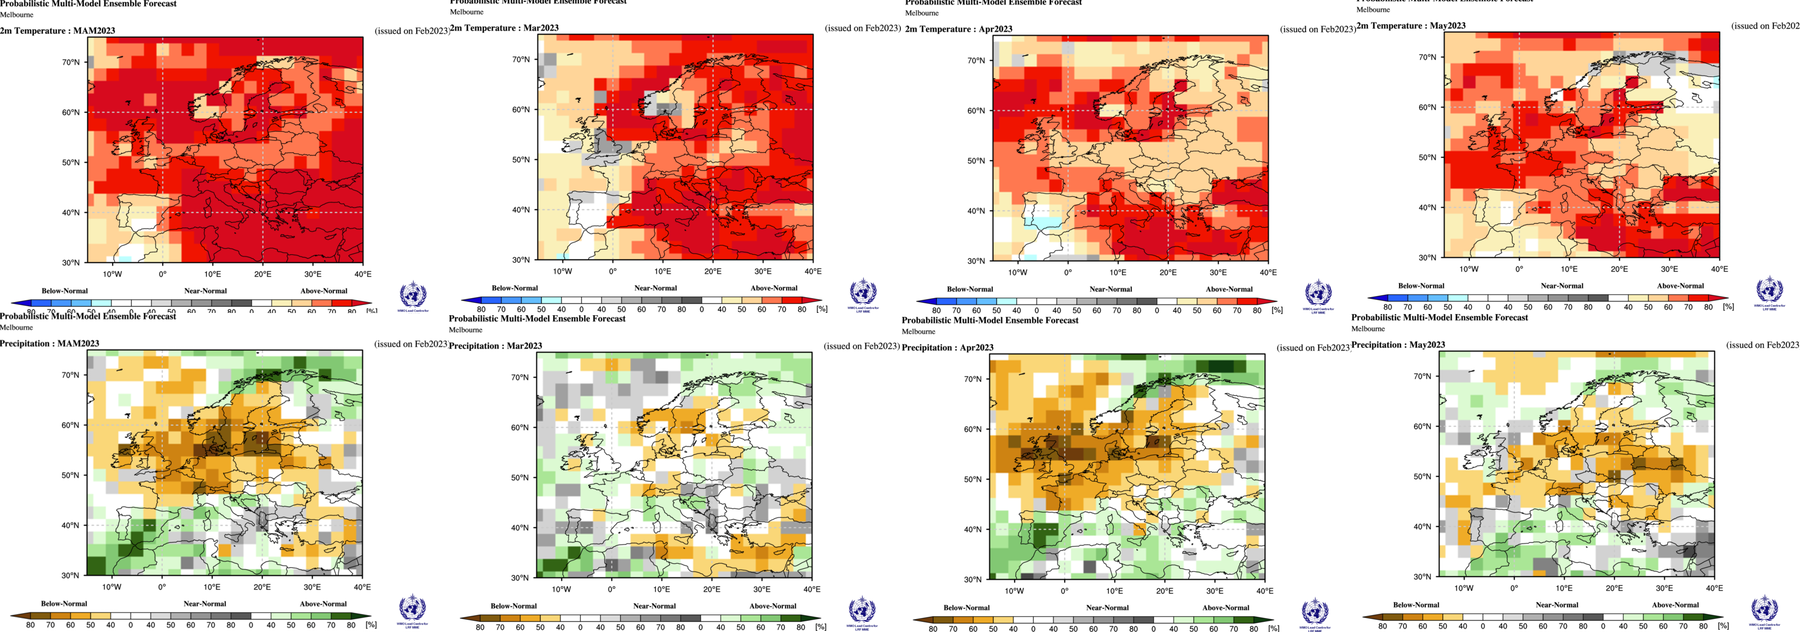
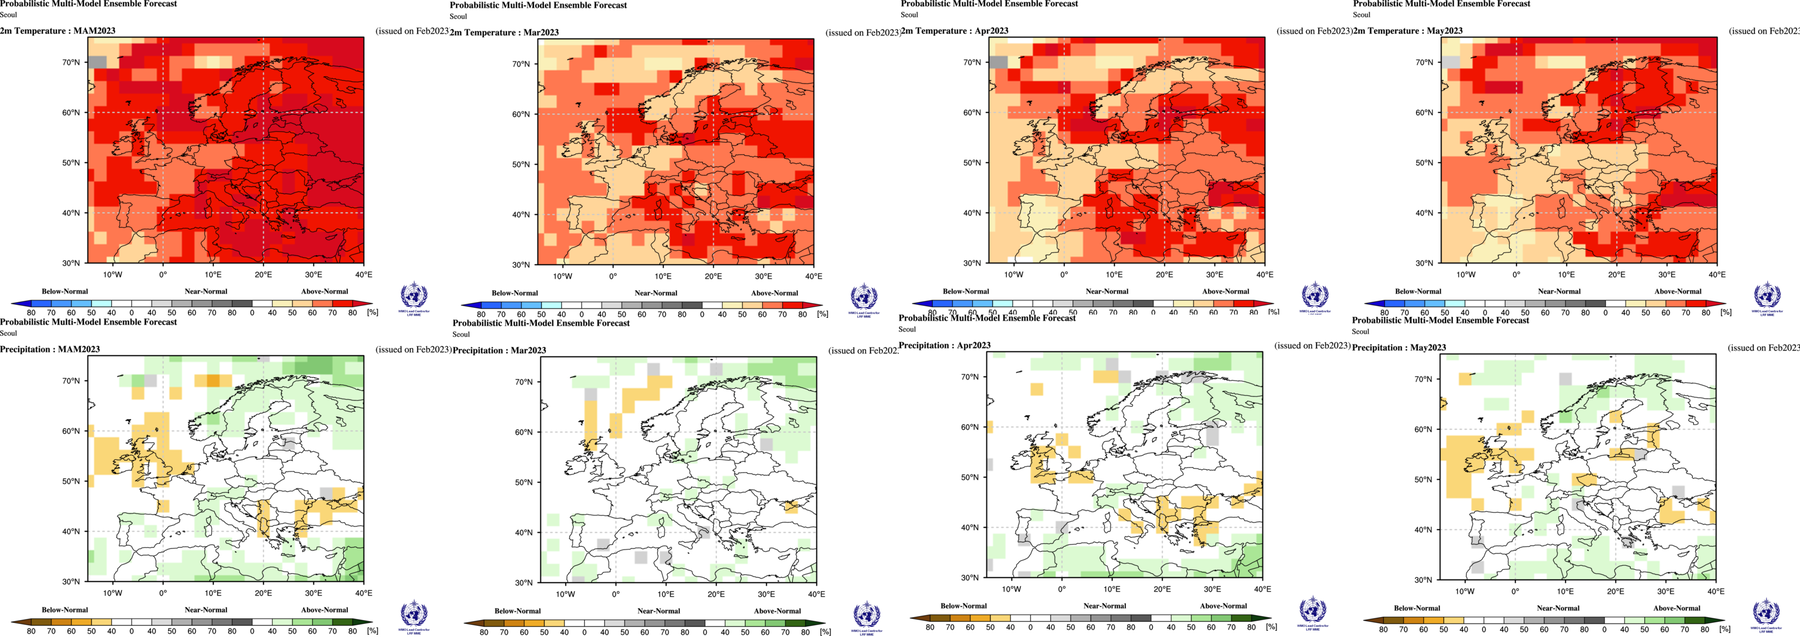
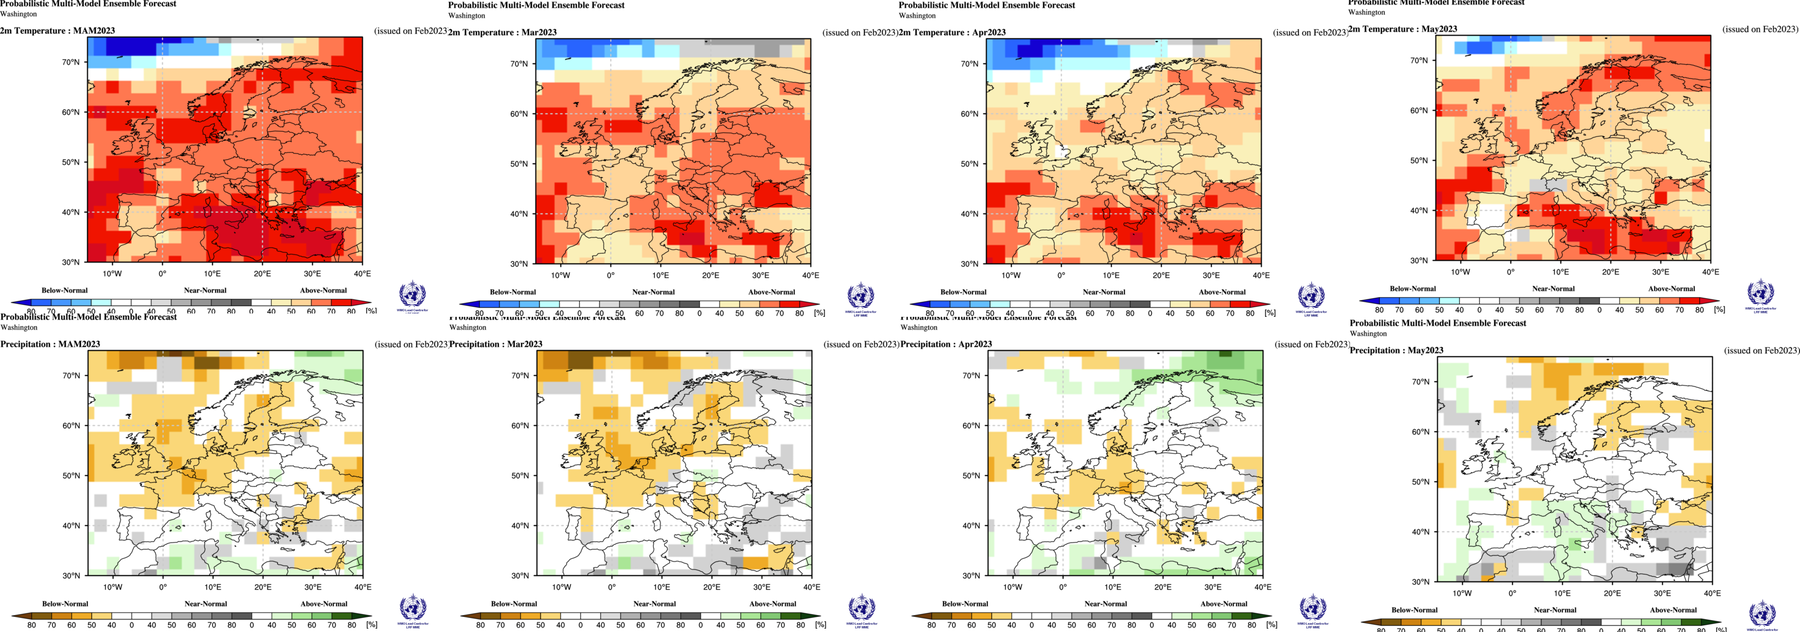
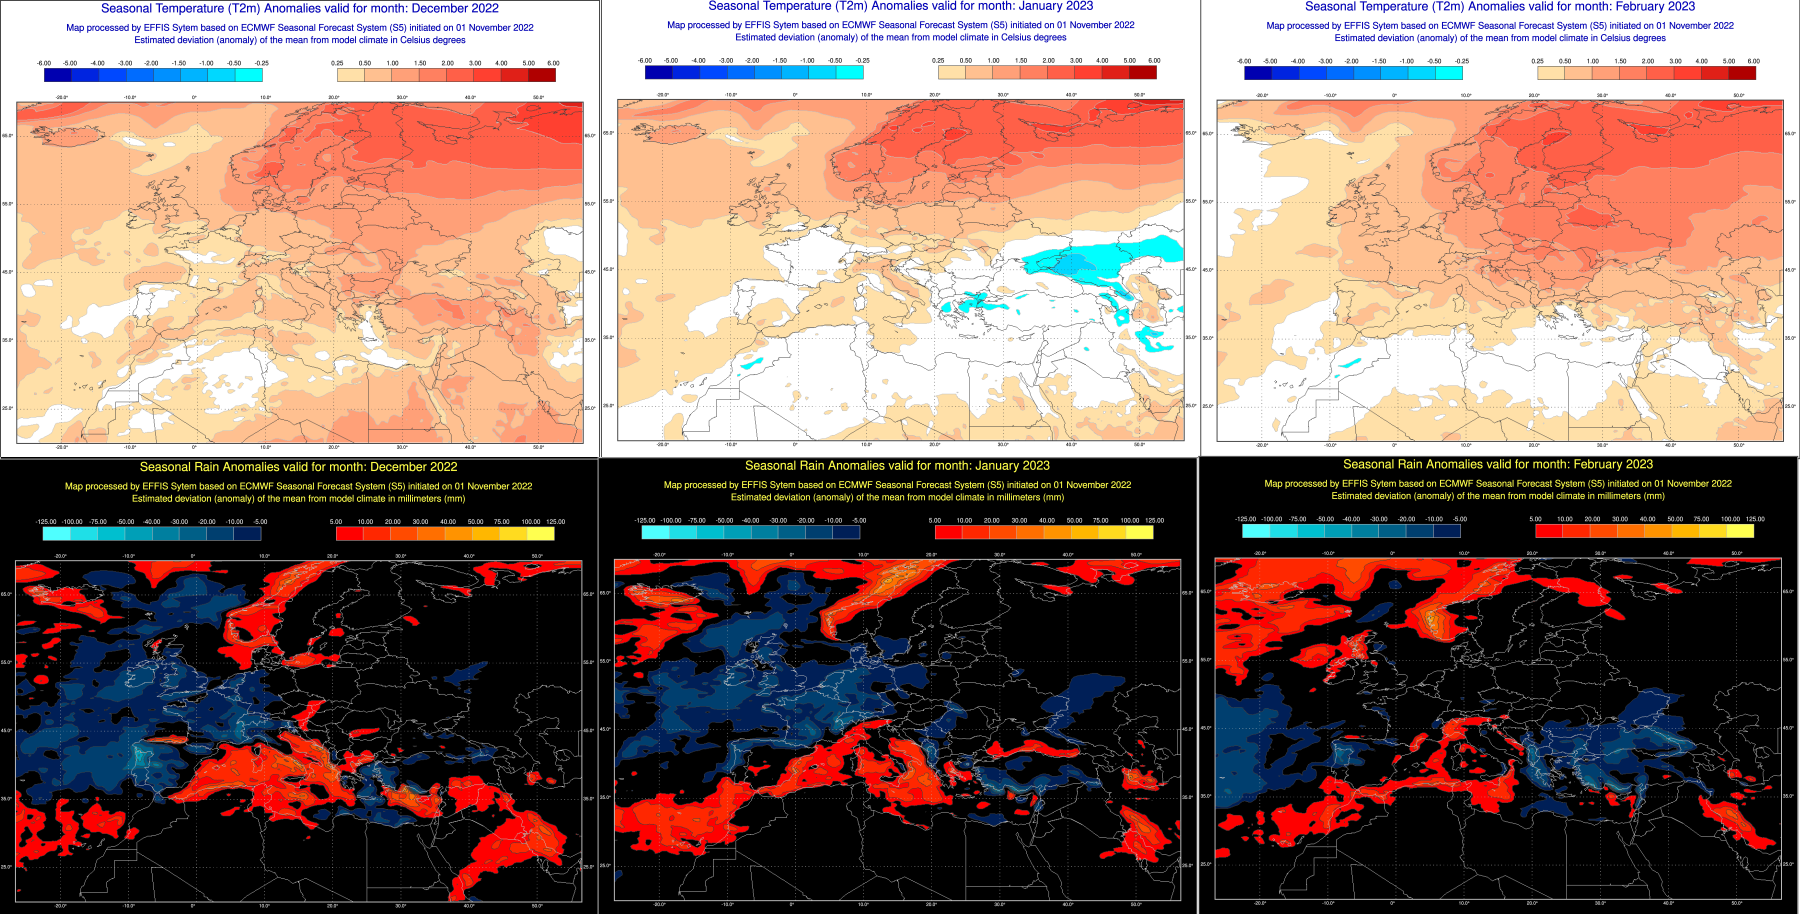
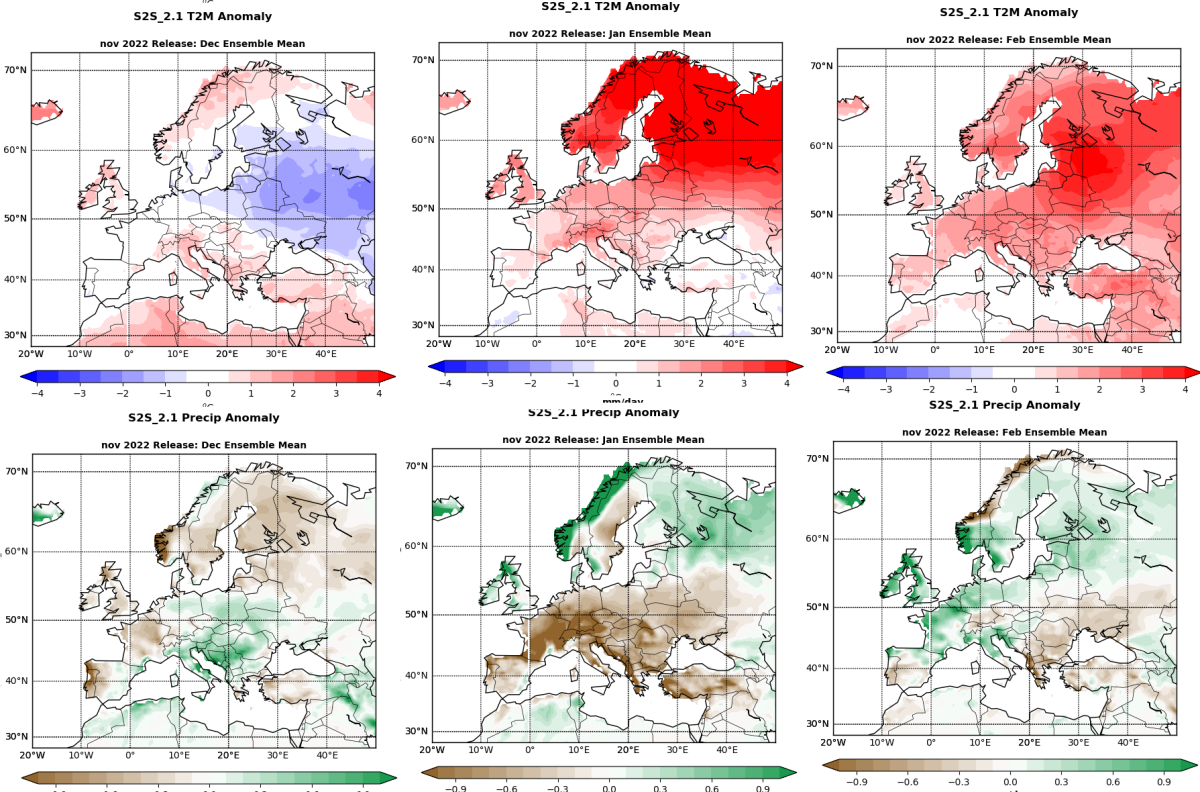
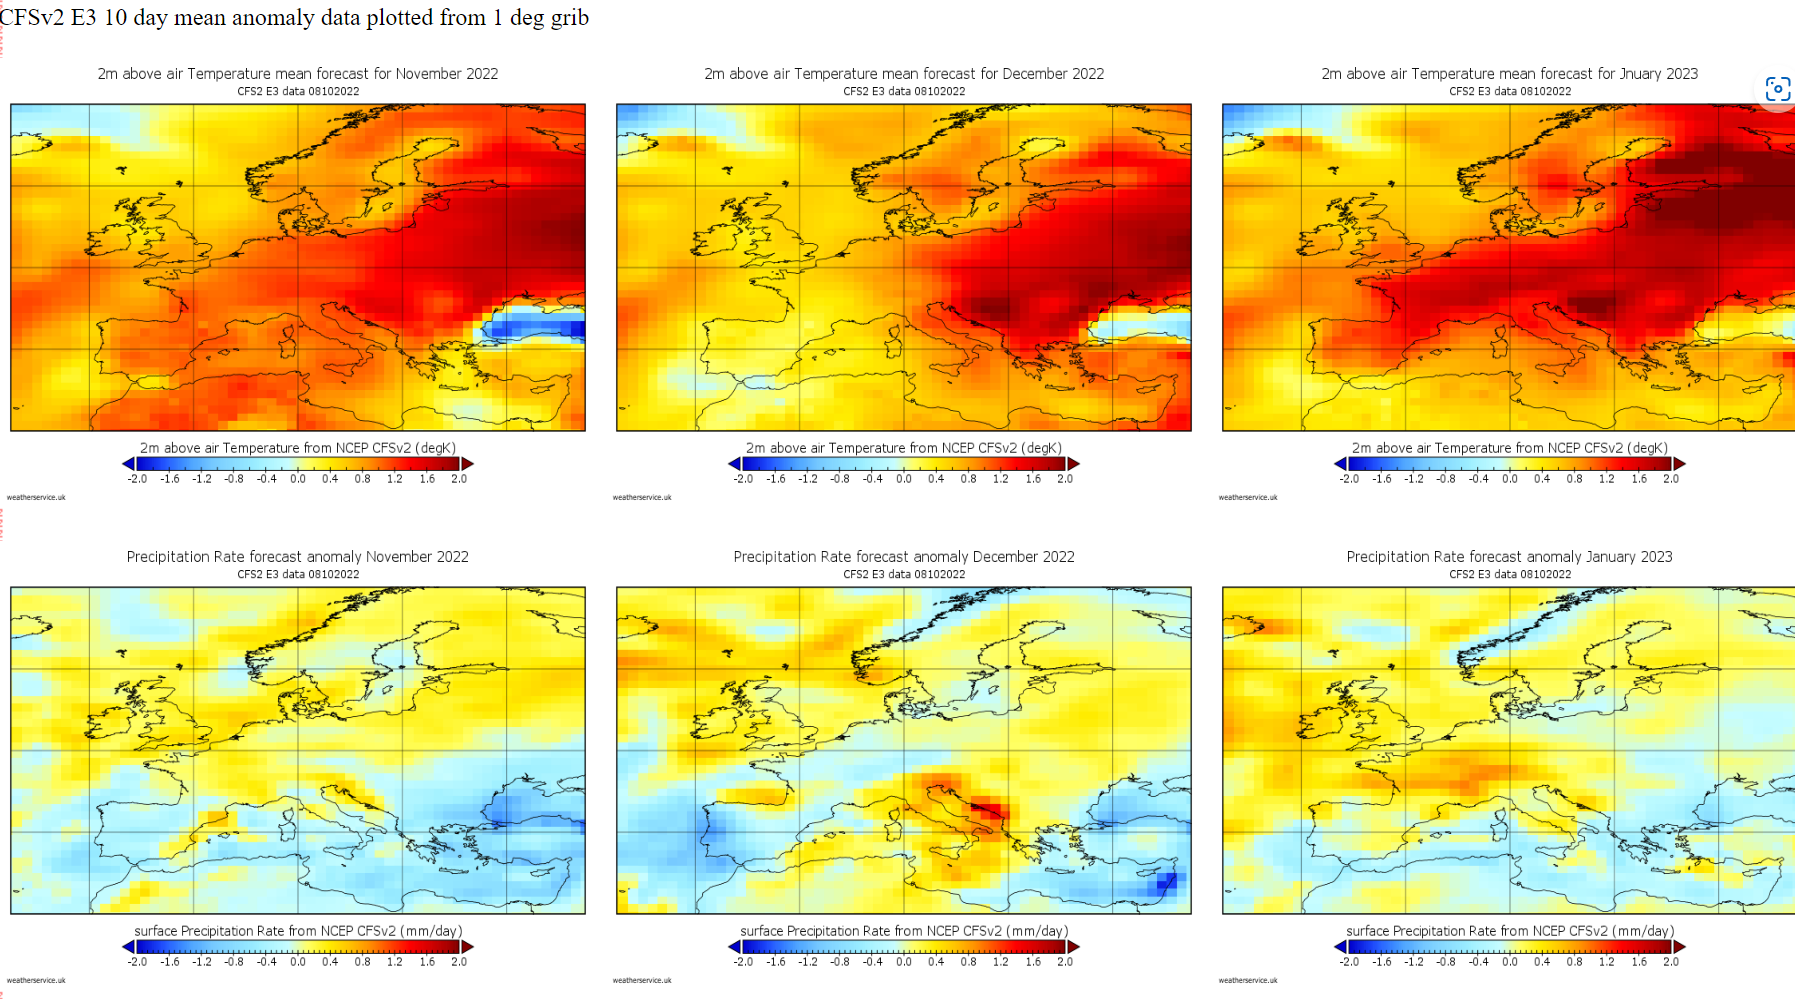
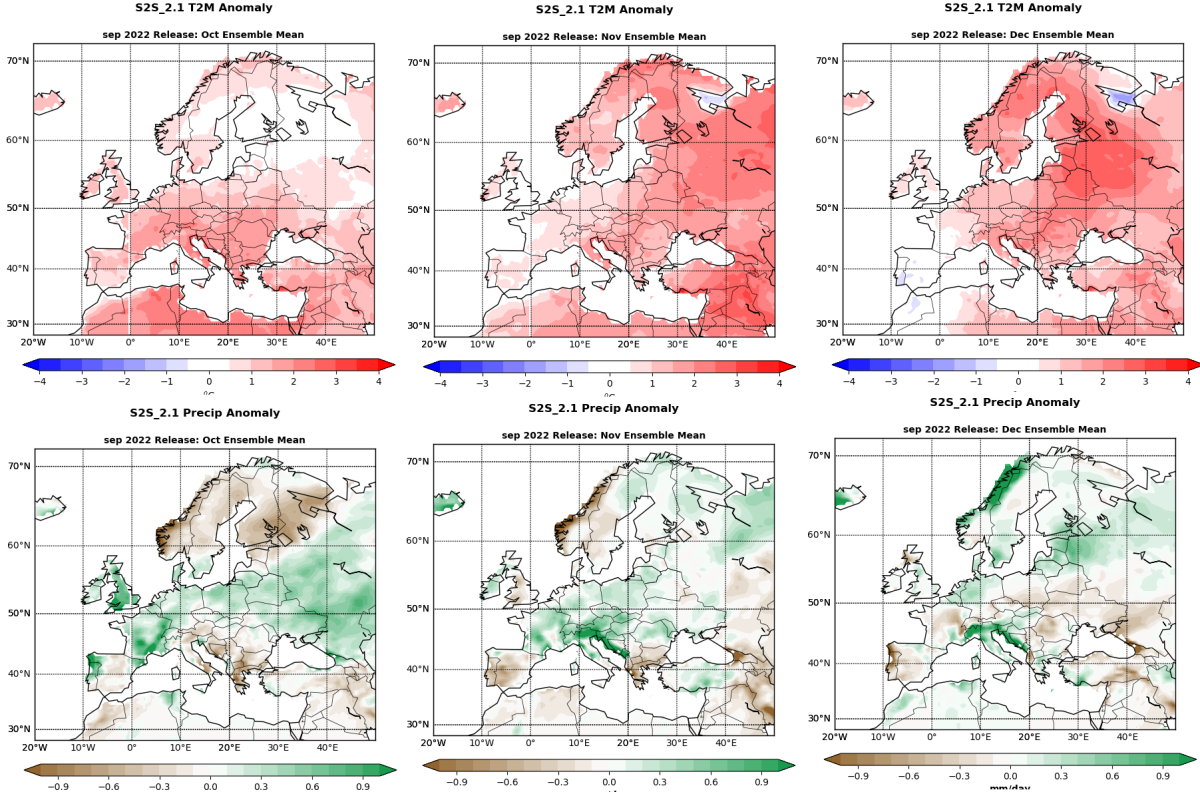
A selection of model solutions for July to September 2023 using June data are shown below. The full set, including available graphics for Autumn 2023 can be found at https://www.weather-info.co.uk/wxsvc/seaslatest.html
Top row temperature anomaly. Lower row precipitation anomaly
July to September 2023


NASA EU area not available.
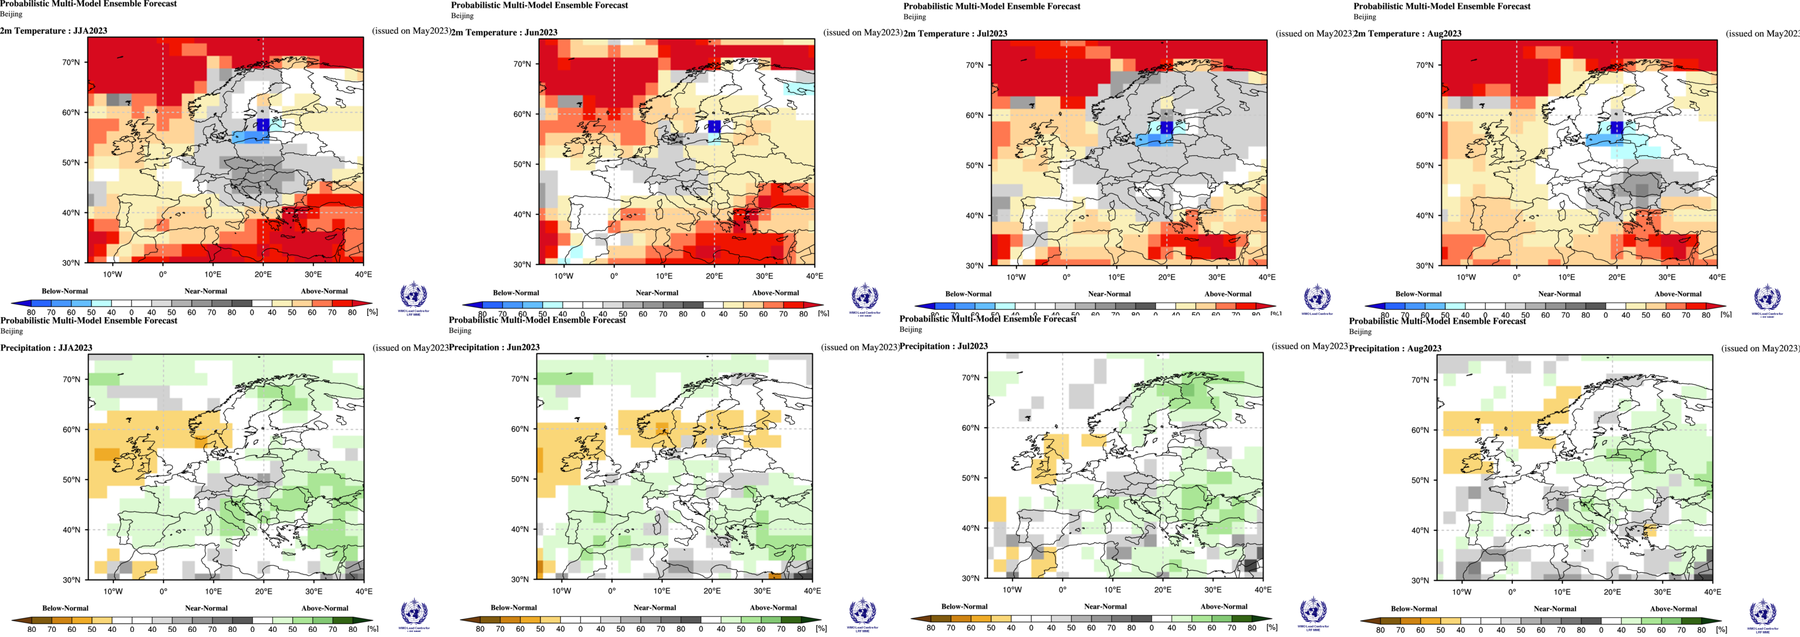
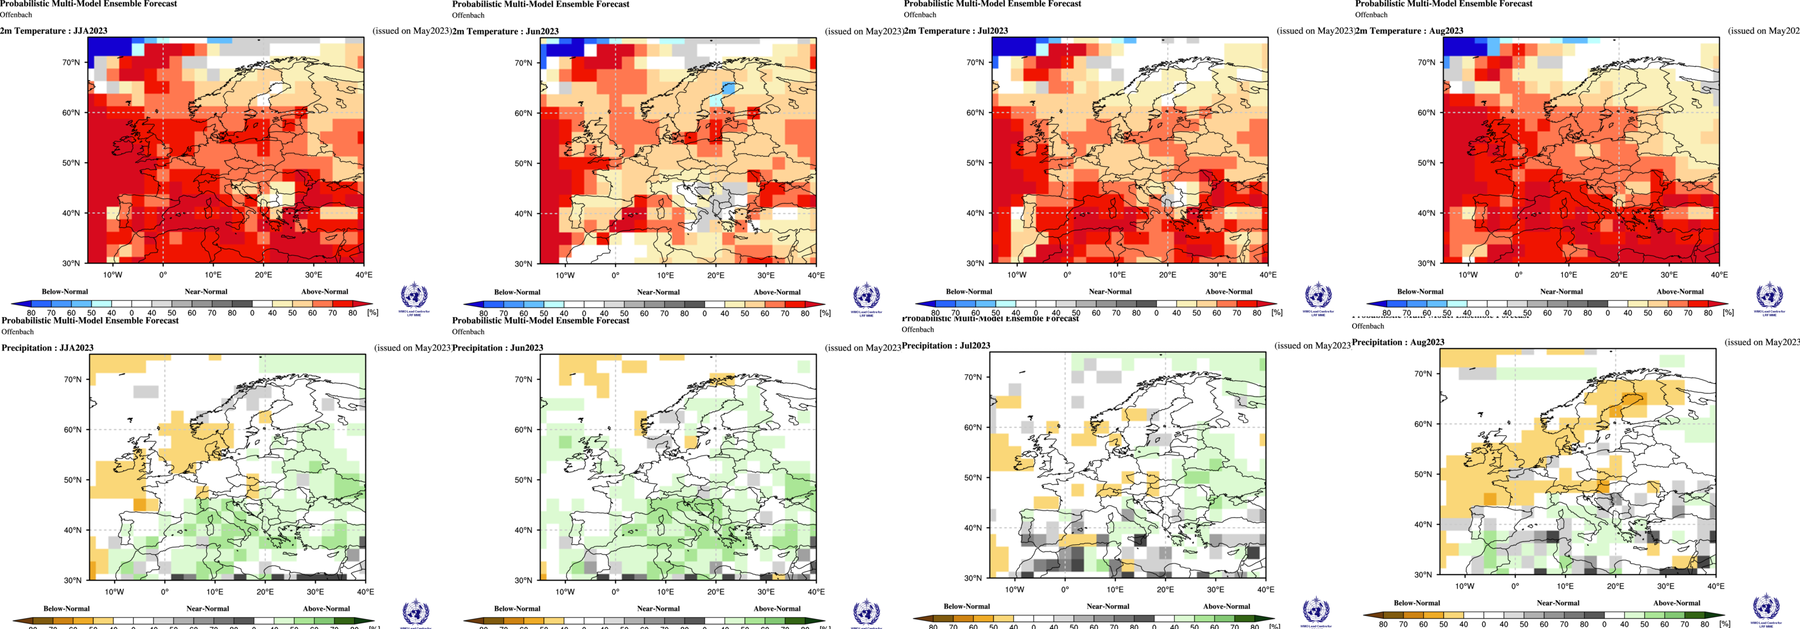
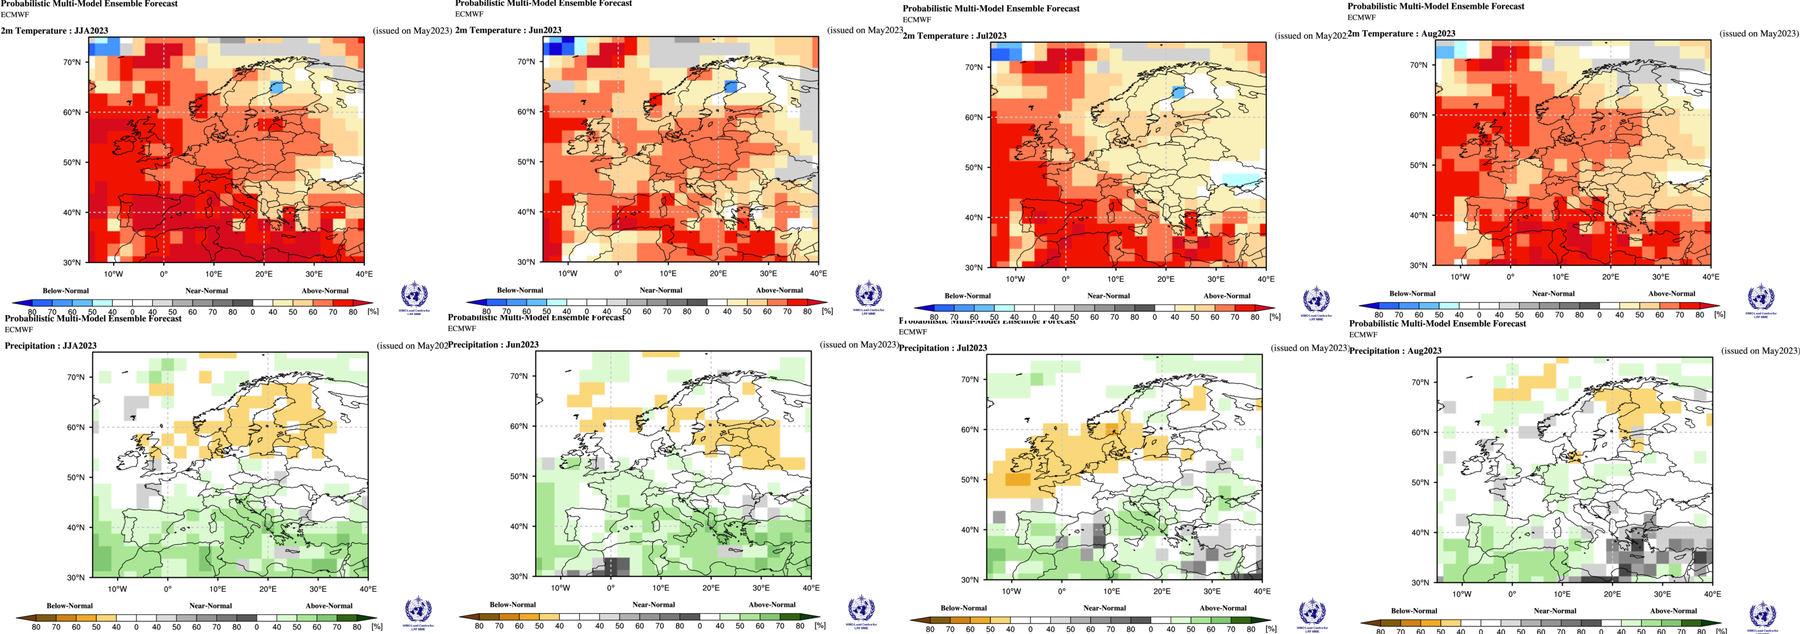
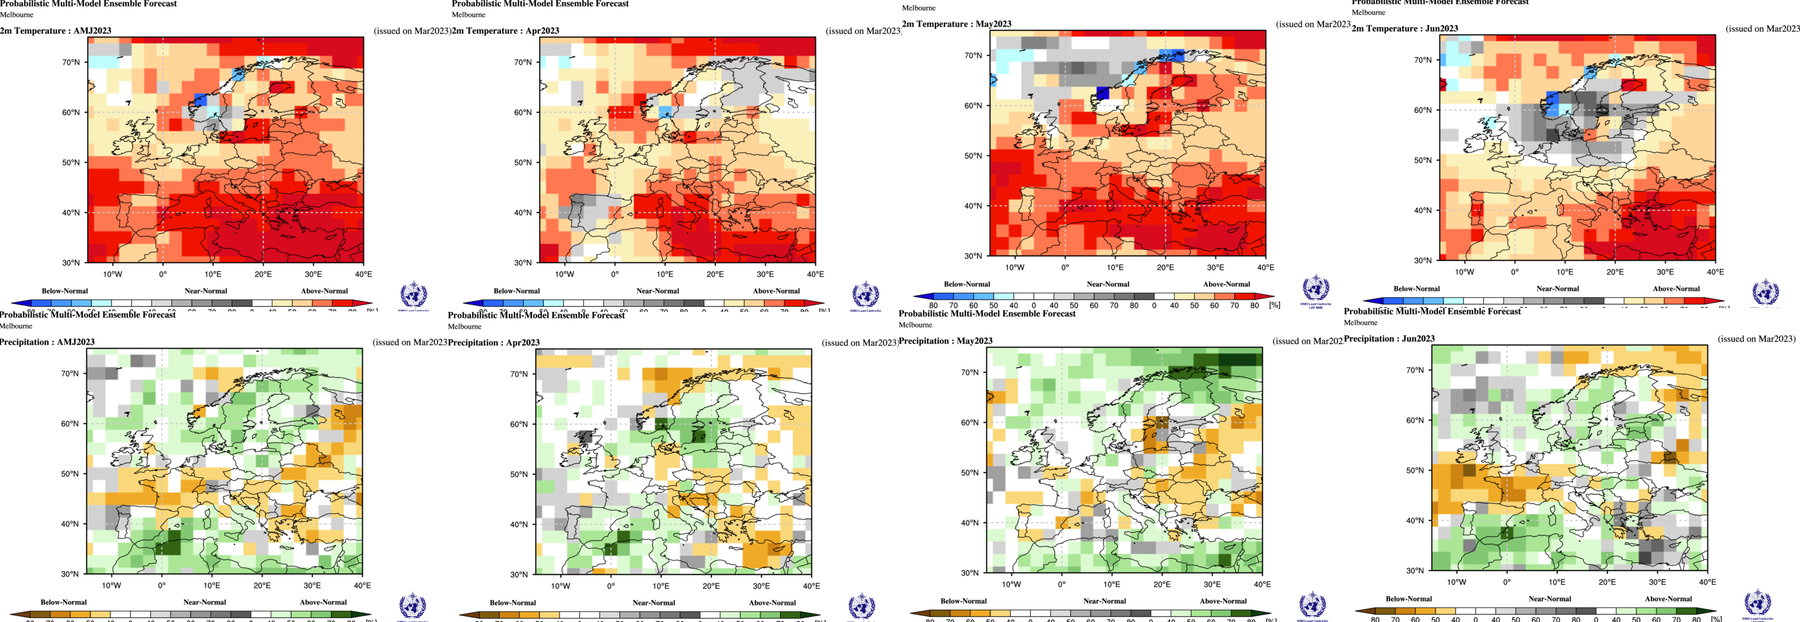
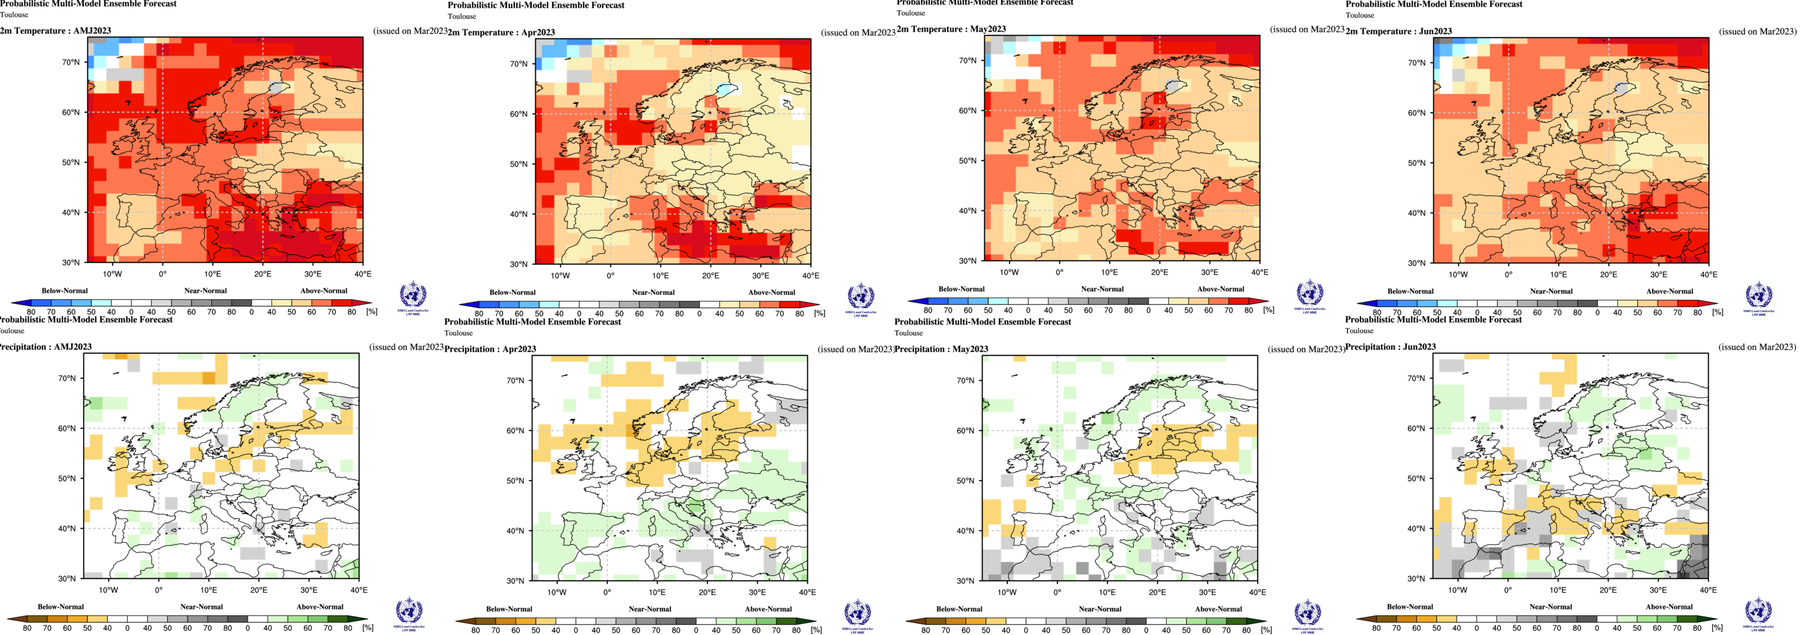
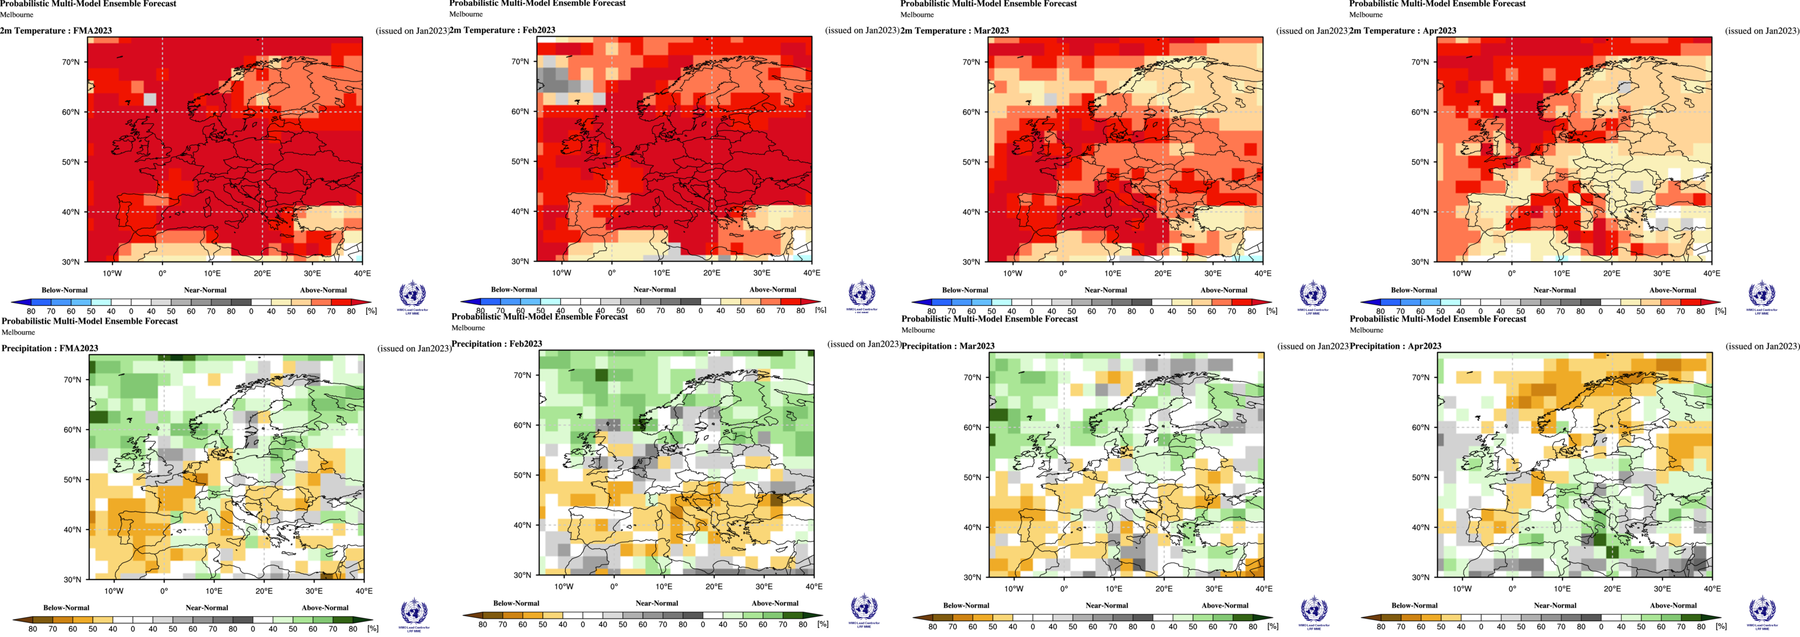
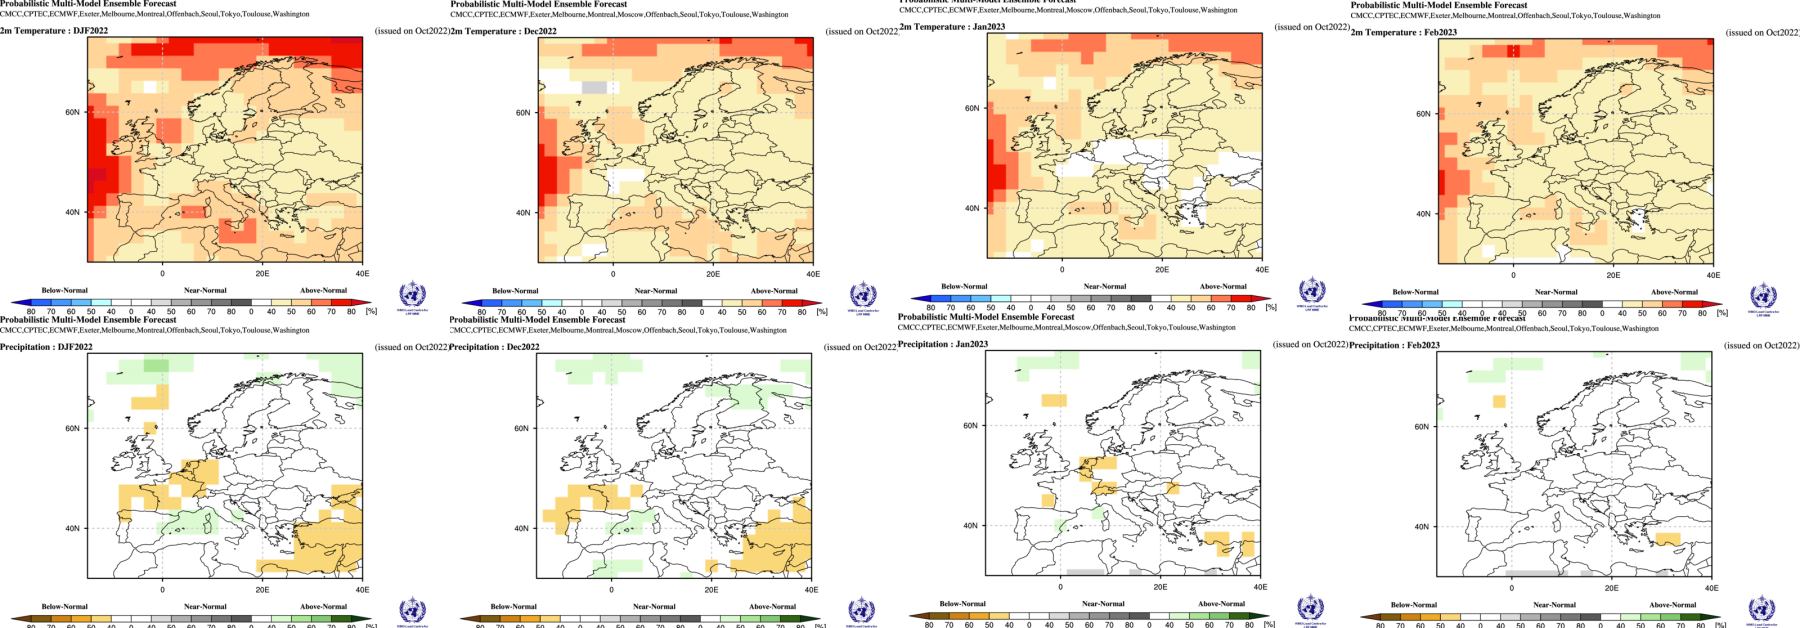
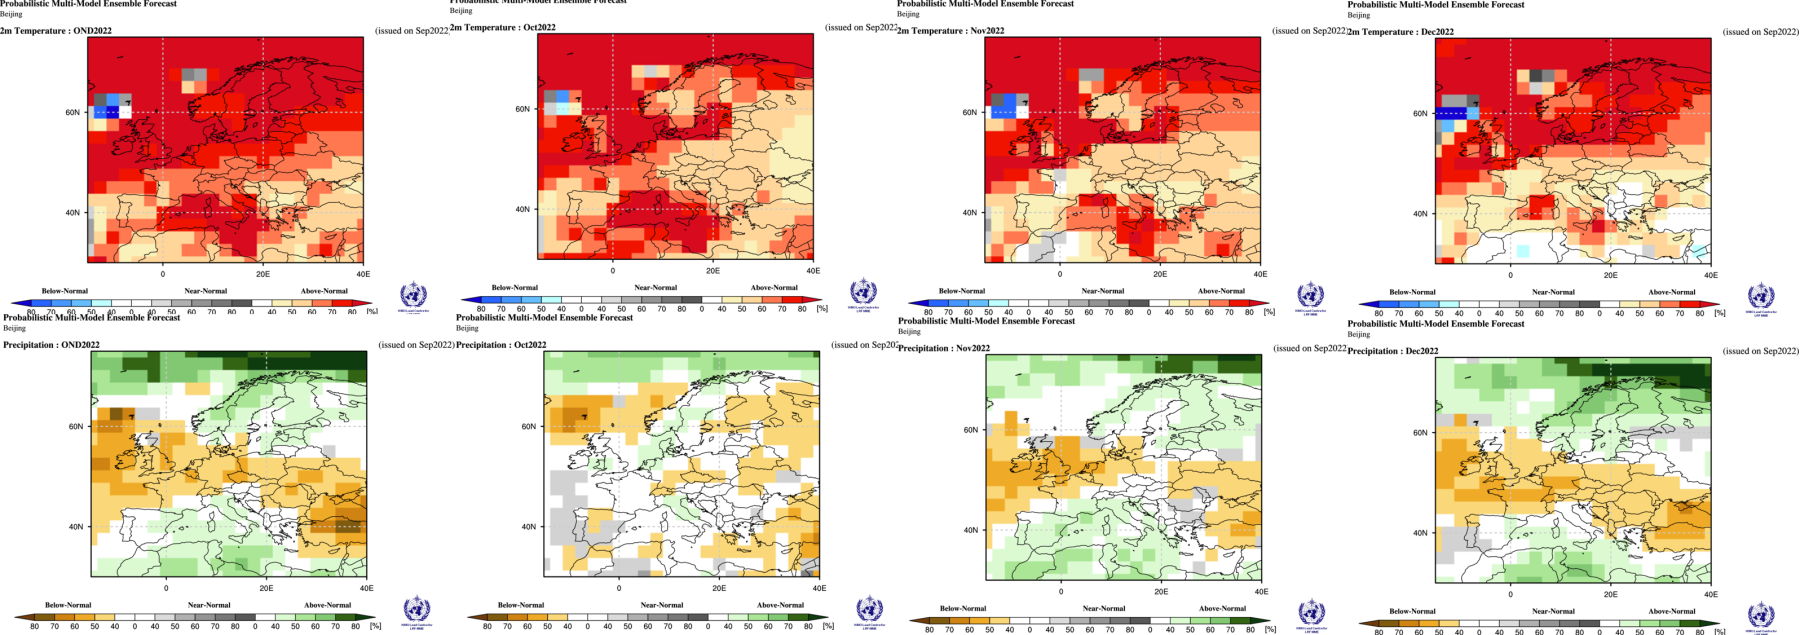
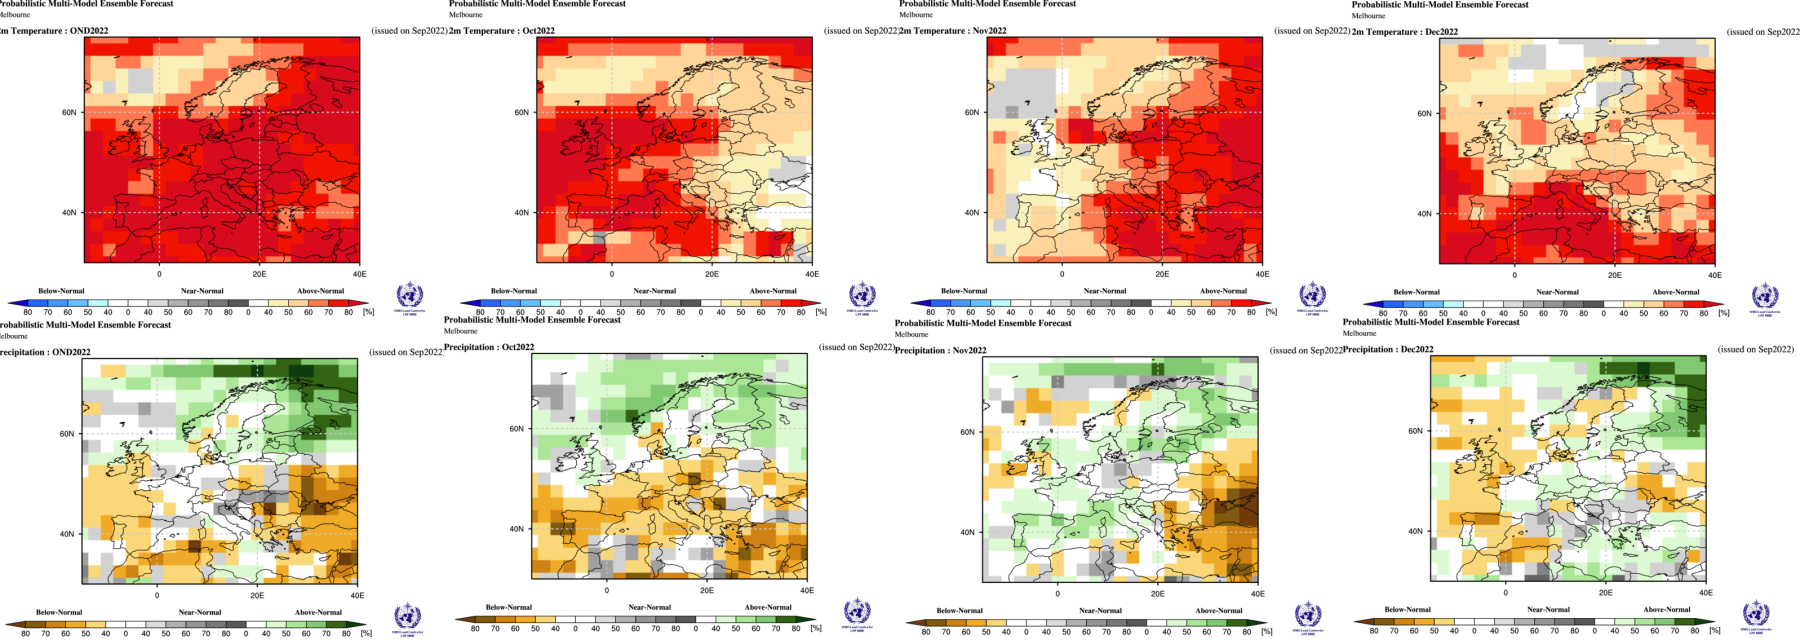
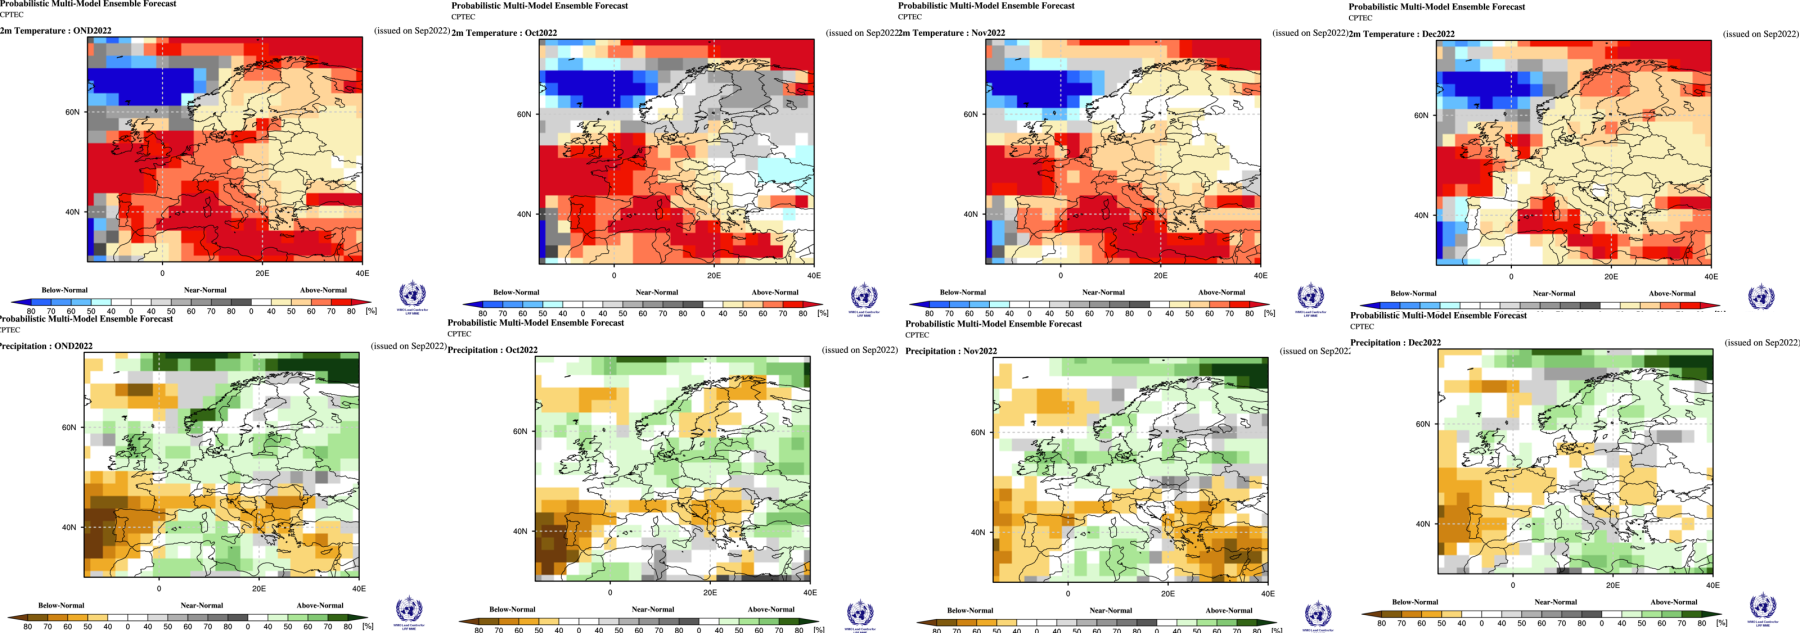
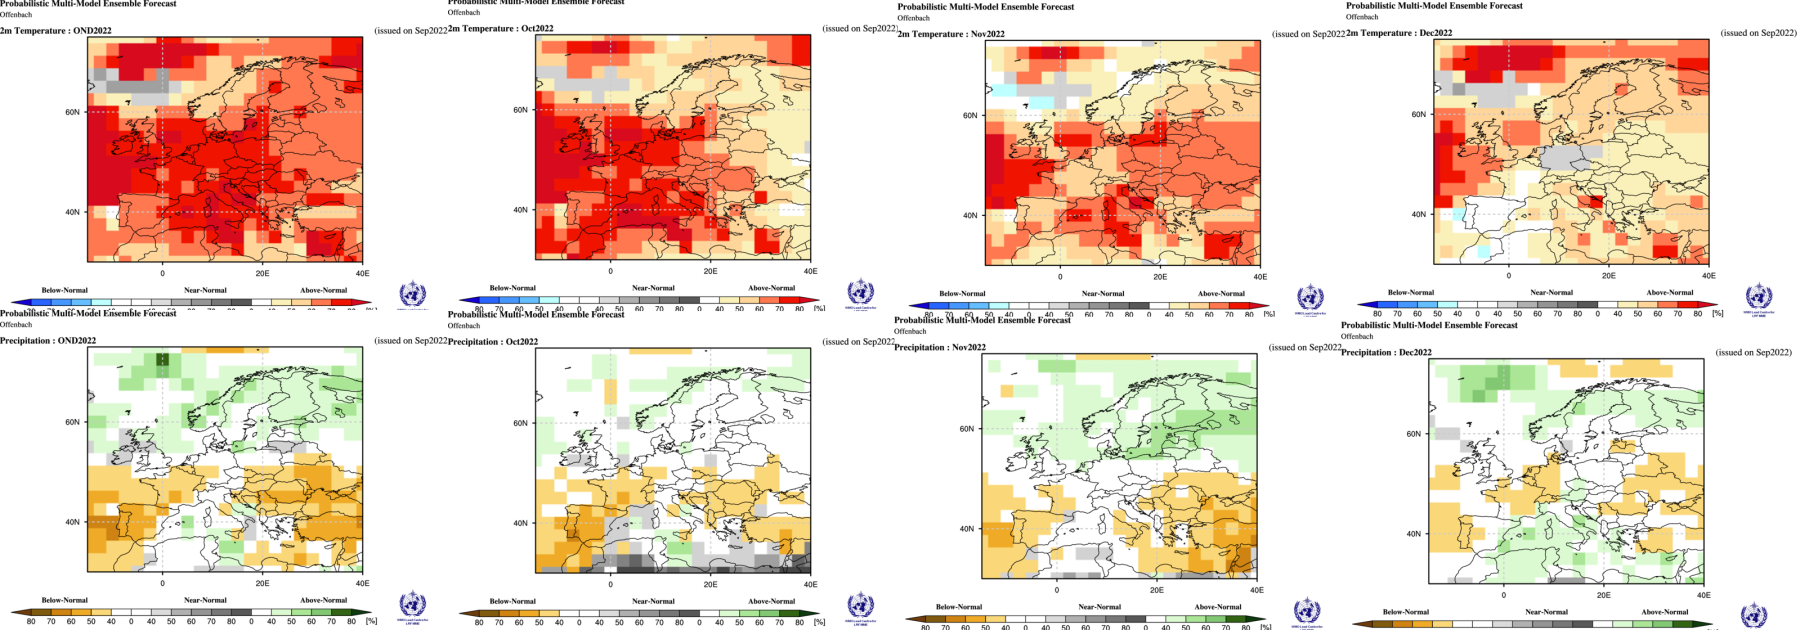
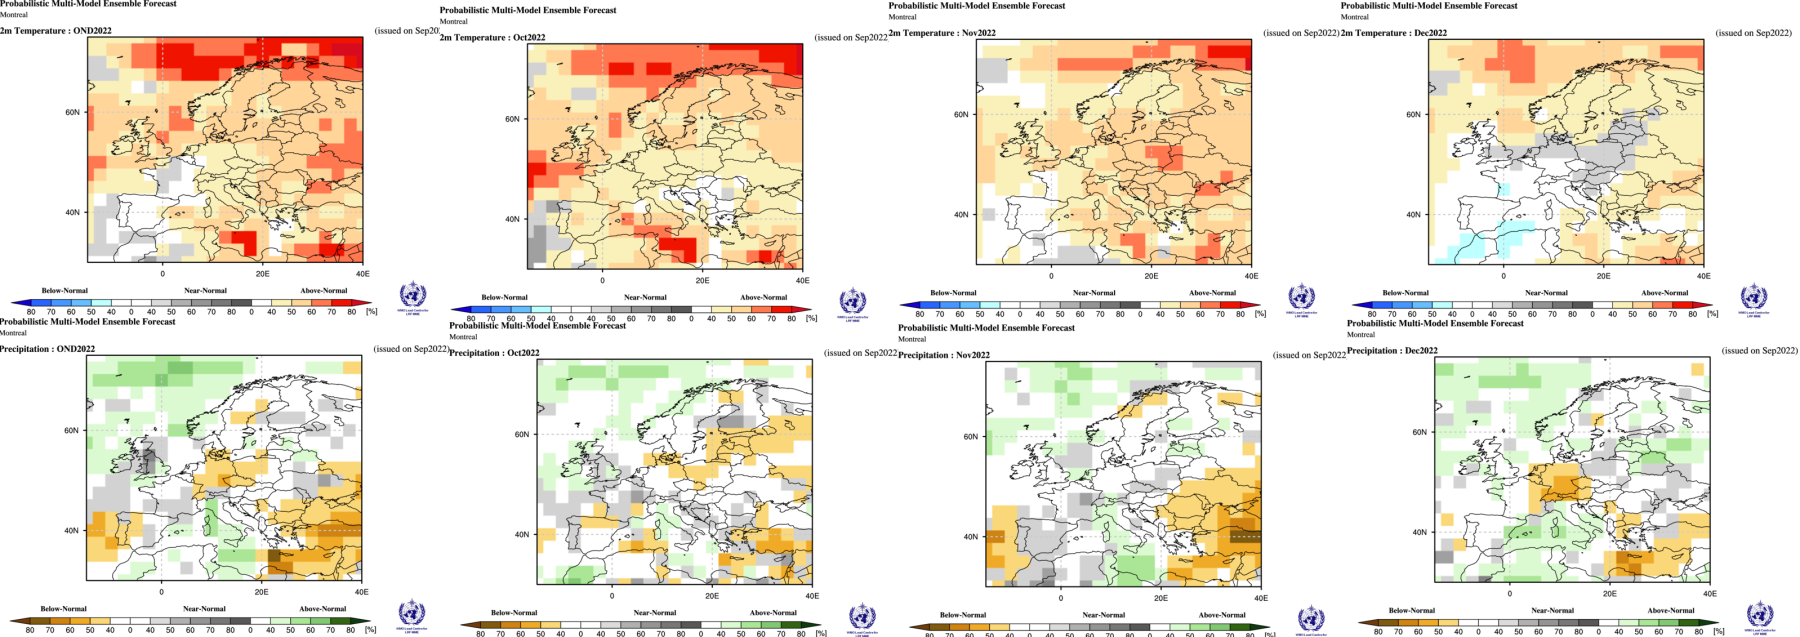
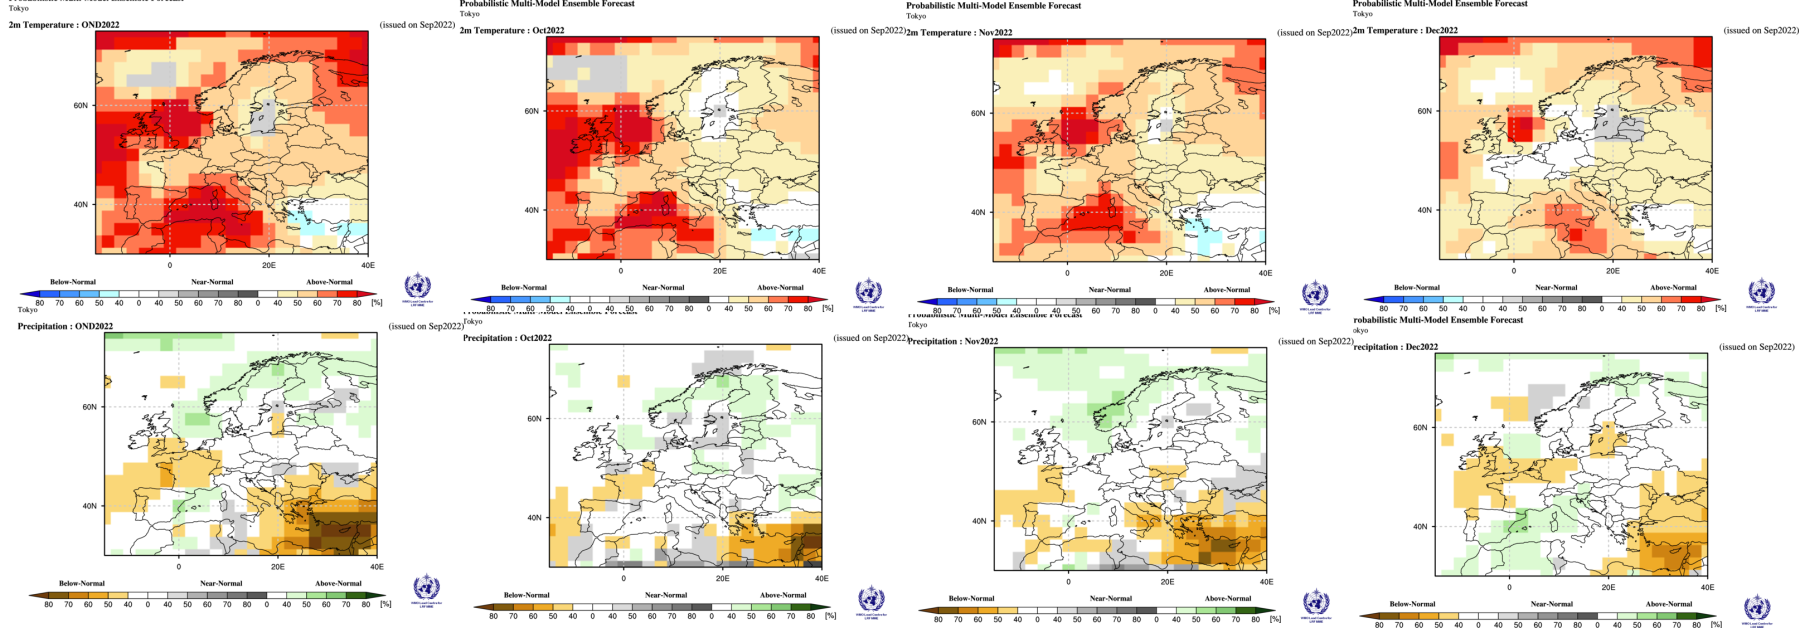
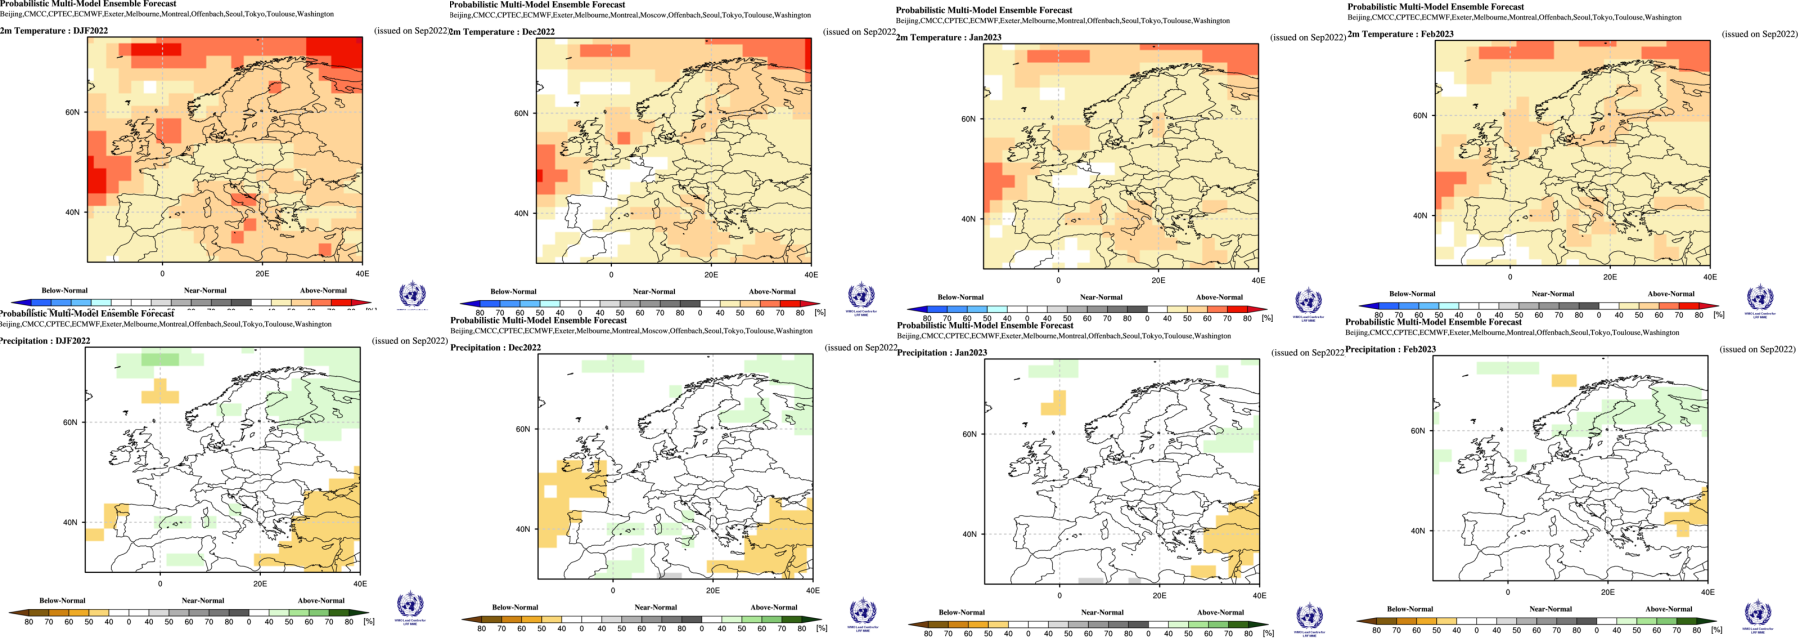
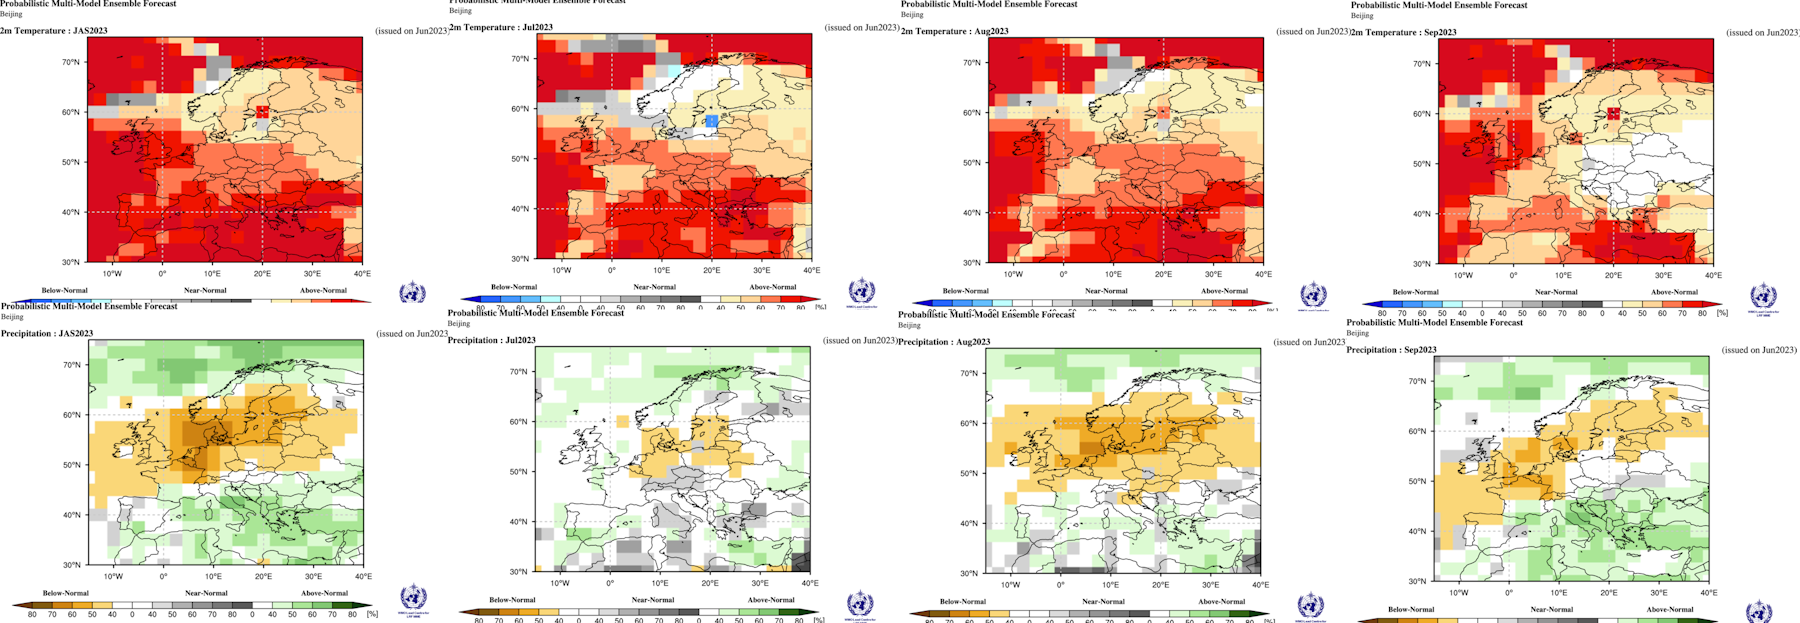
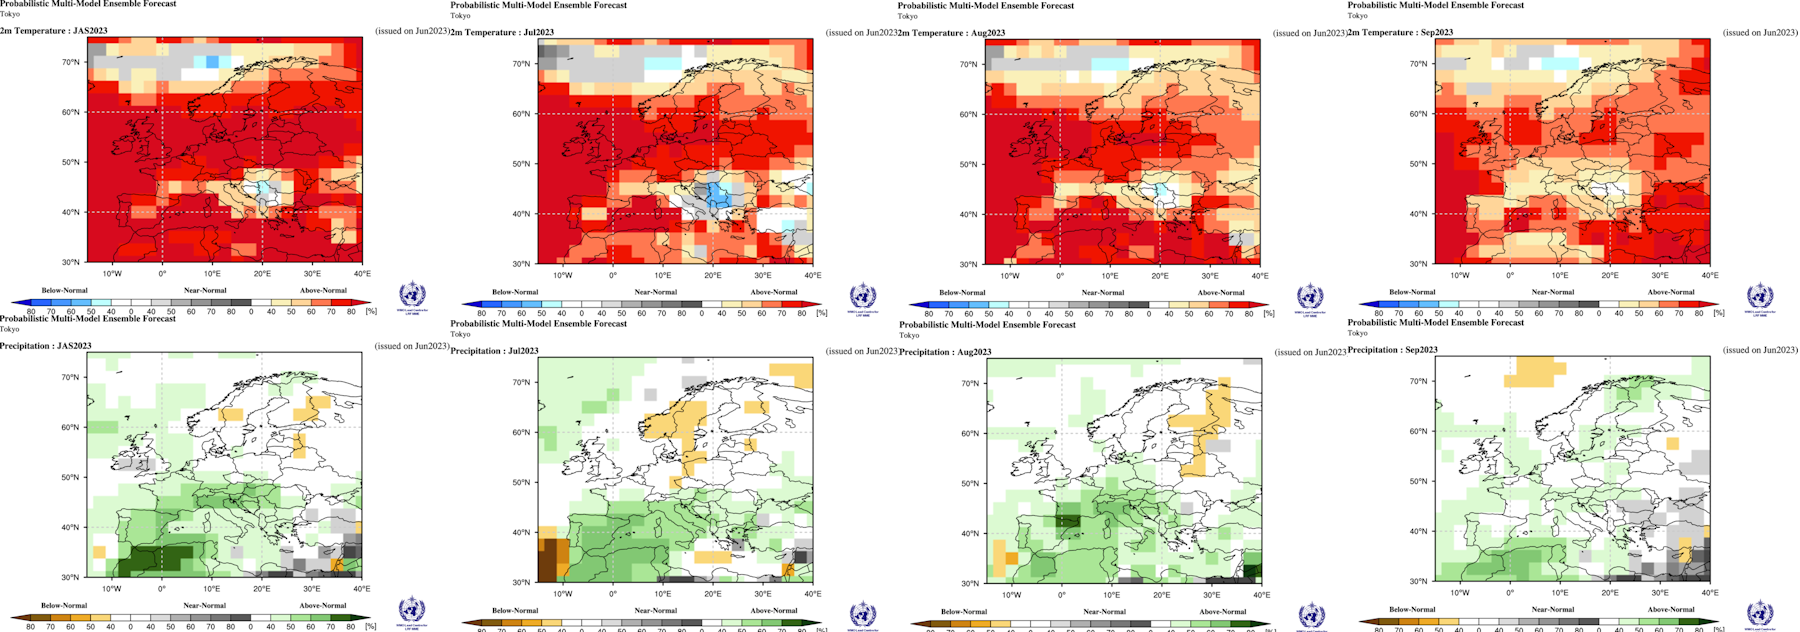
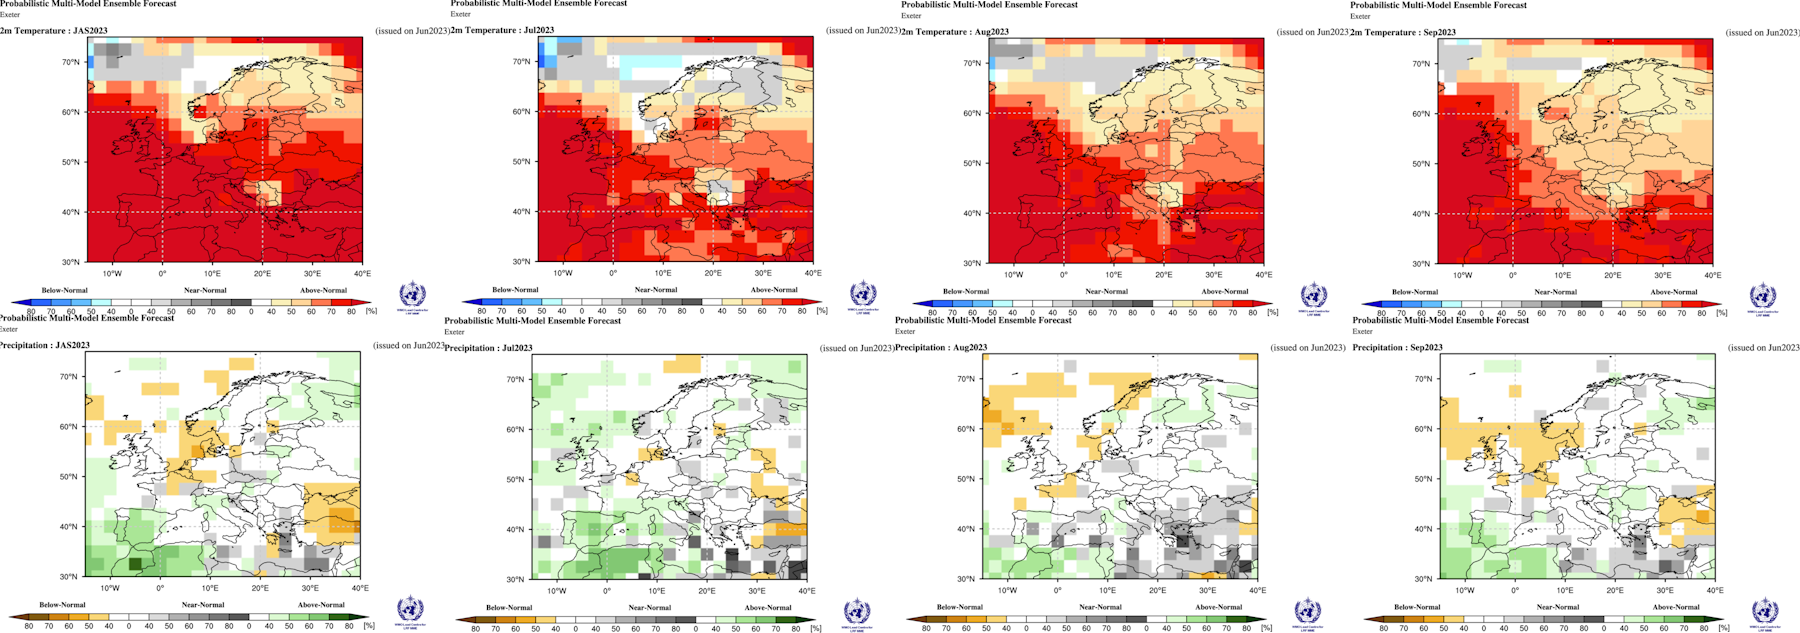
Data from WMO:
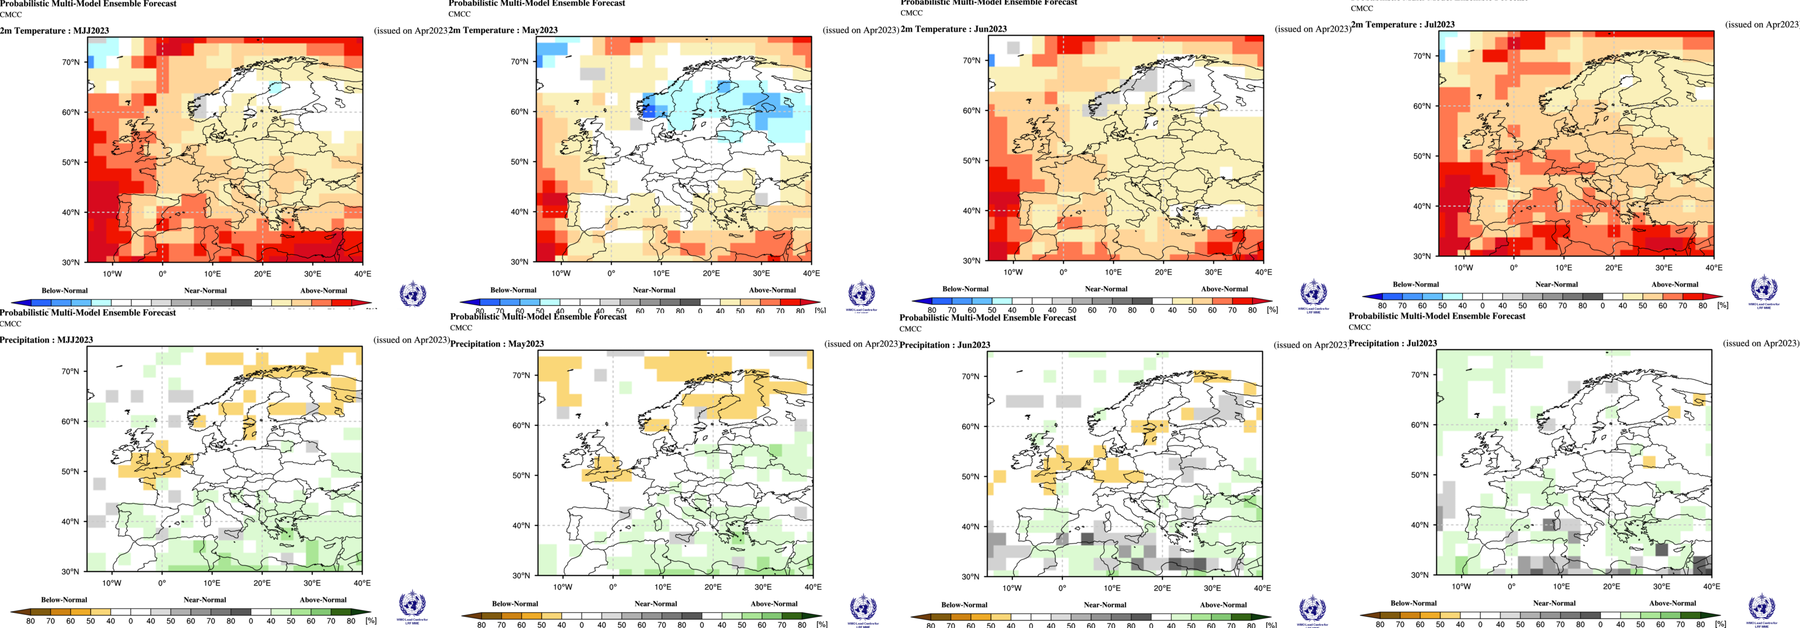
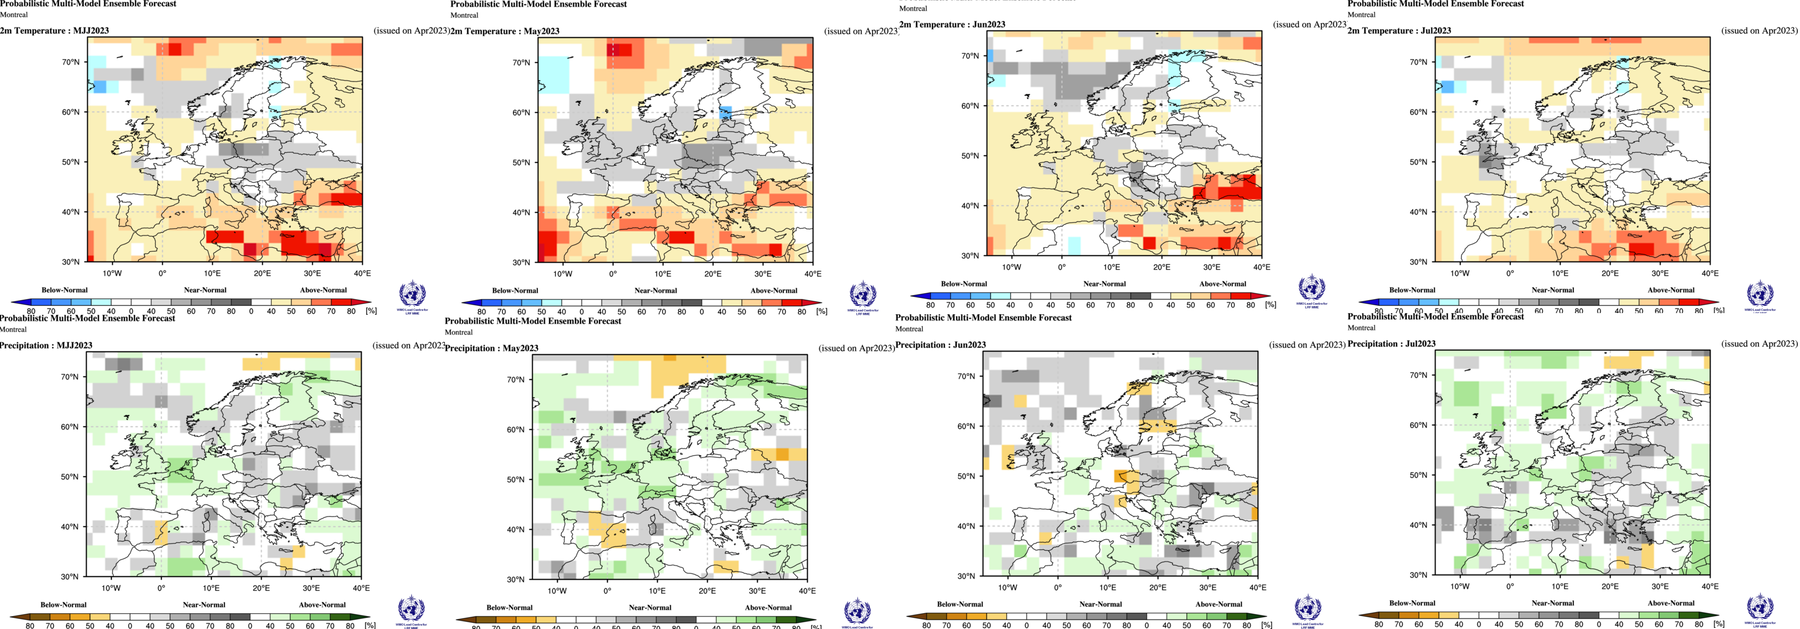
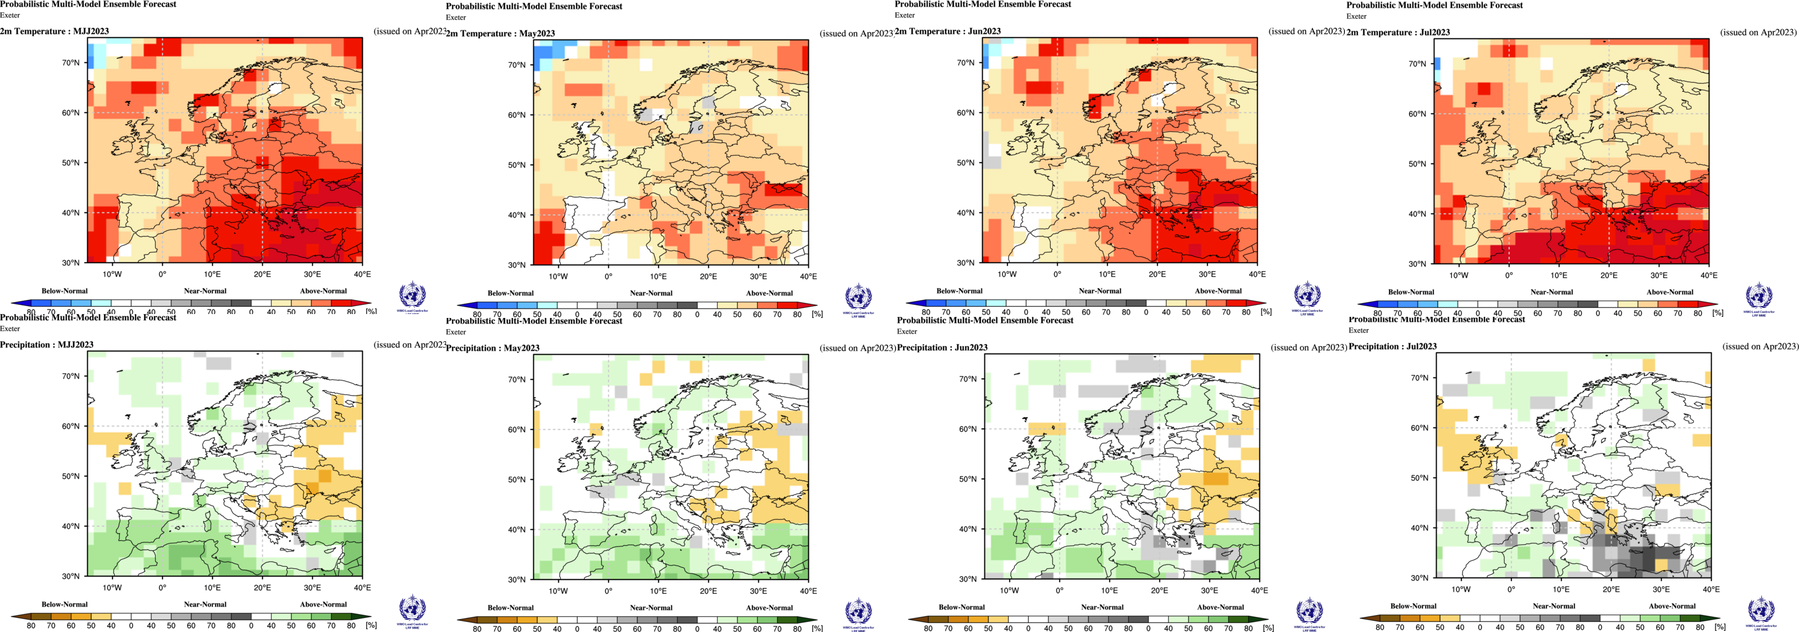
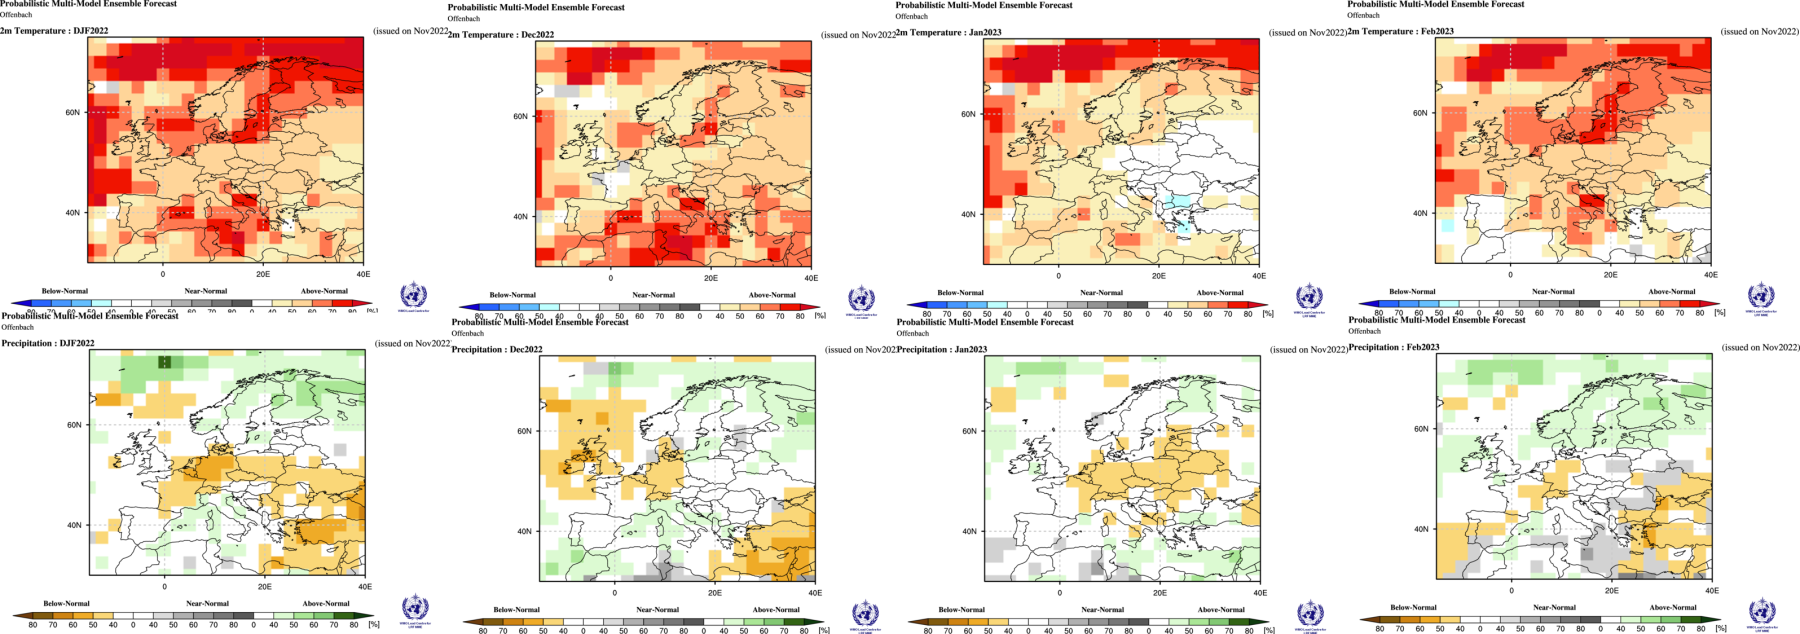
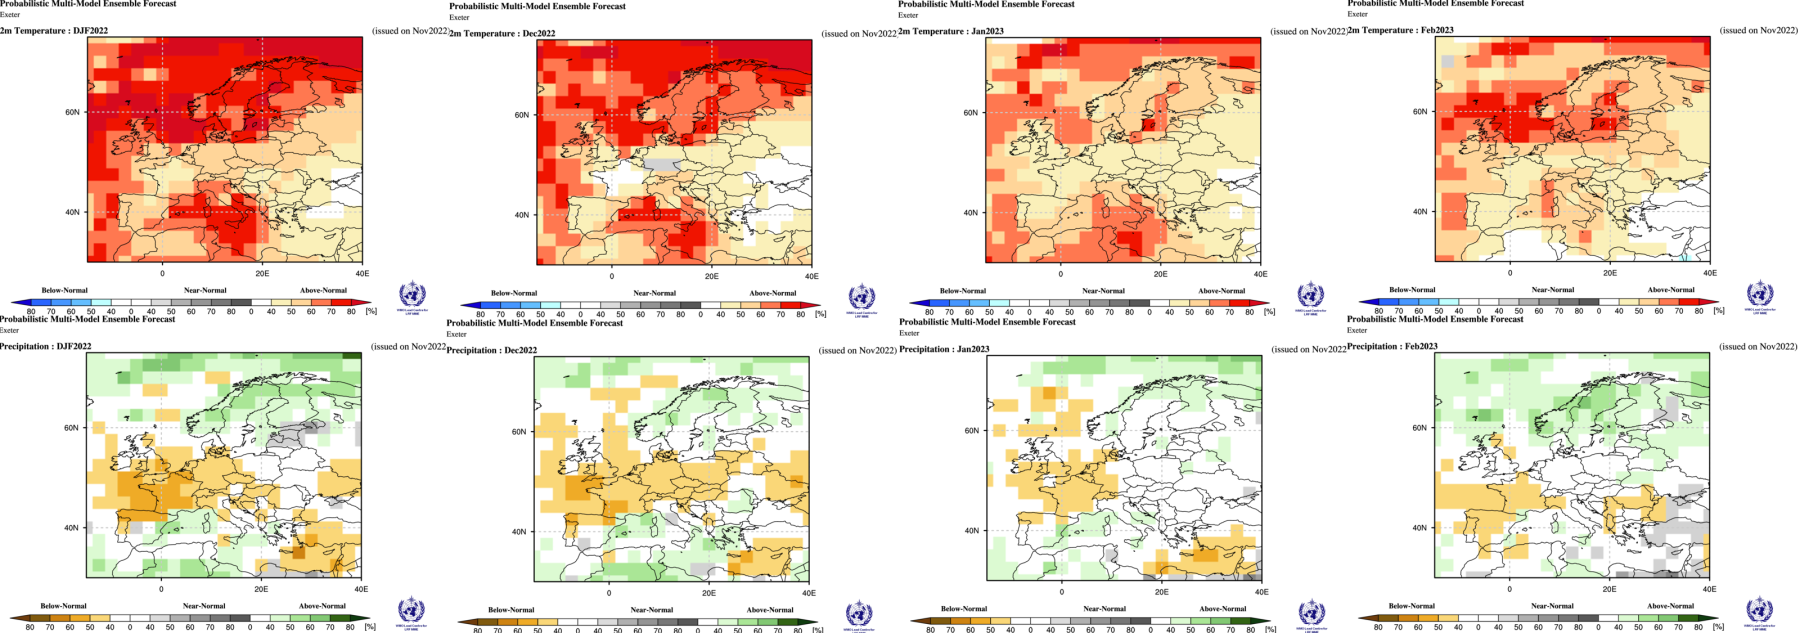
Three month average anomaly followed by July August September 2023. Top row temperature anomaly and lower row precipitation anomaly.
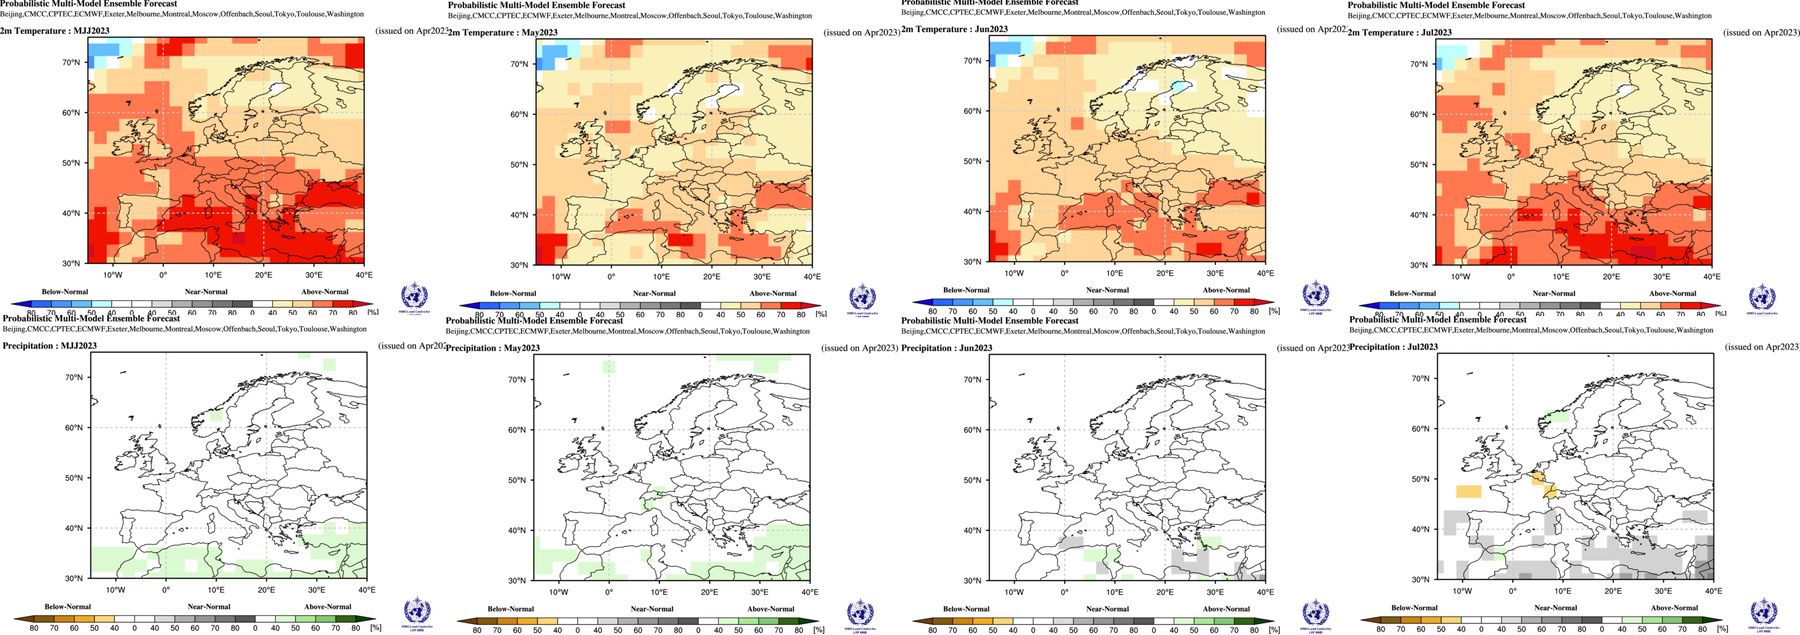
WMO super ensemble (below) is a mean of data supplied by National Meteorological organisations across the globe. Because of the amount of data the output is a low resolution. Note rainfall anomalies show marked cancellation between wetter and drier solutions in some of the multi model ensembles.

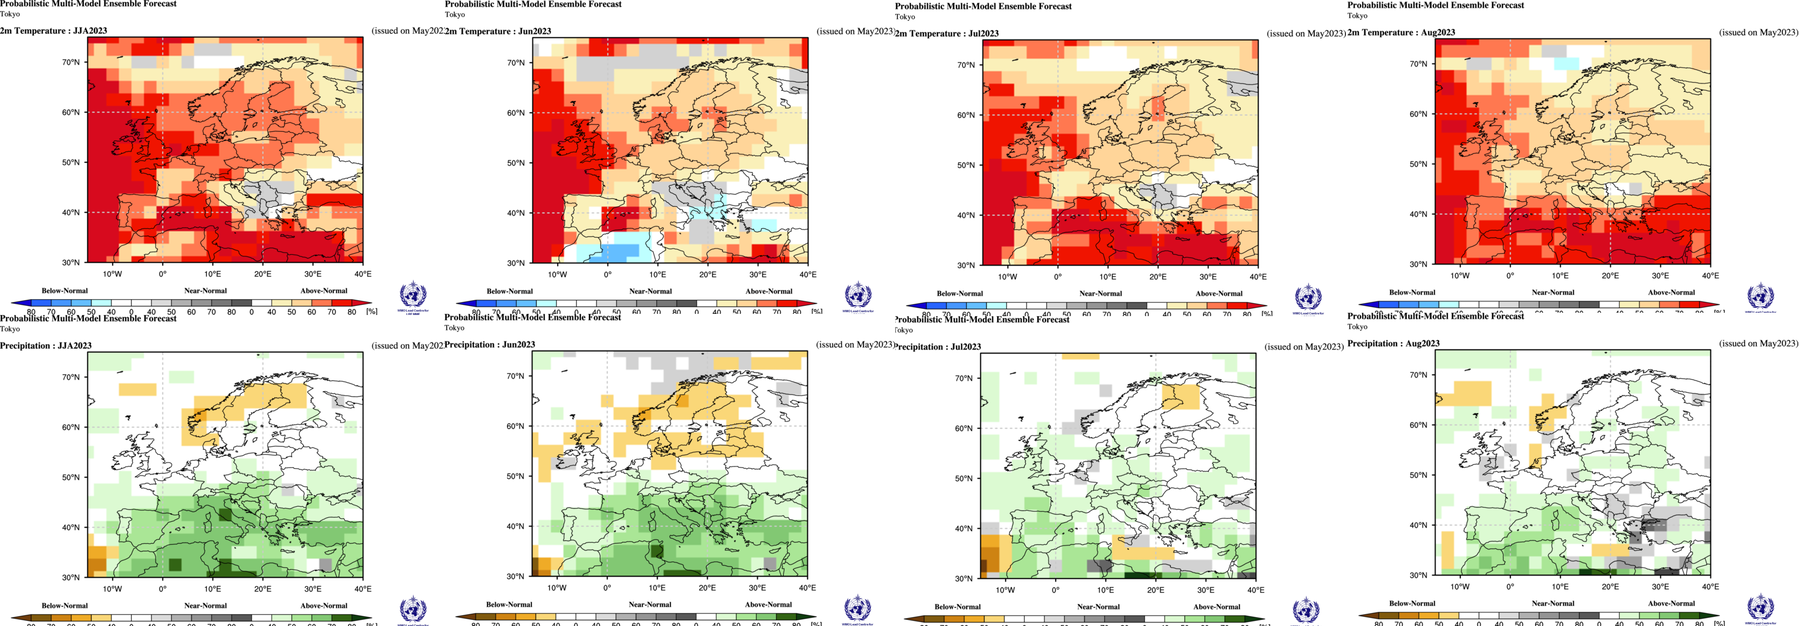
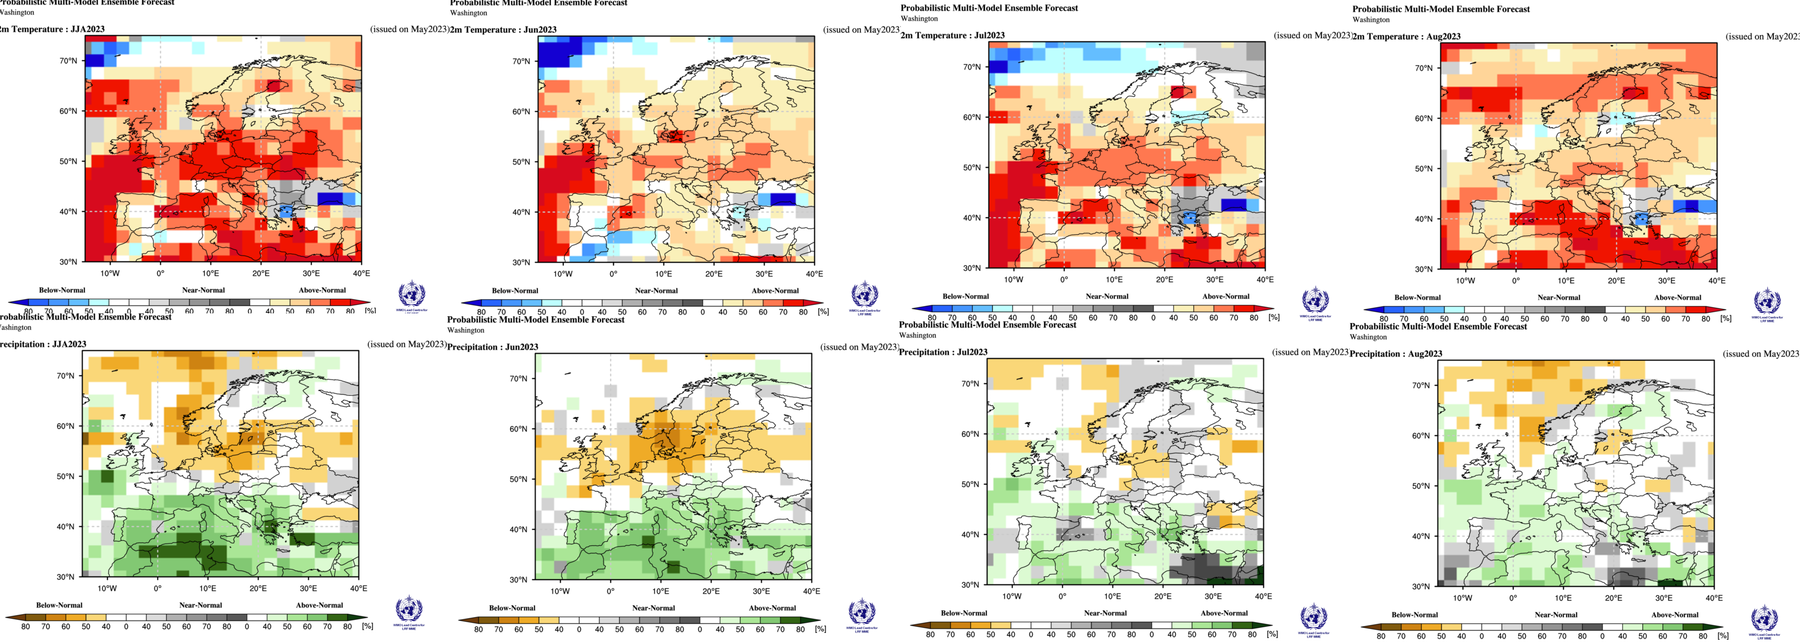
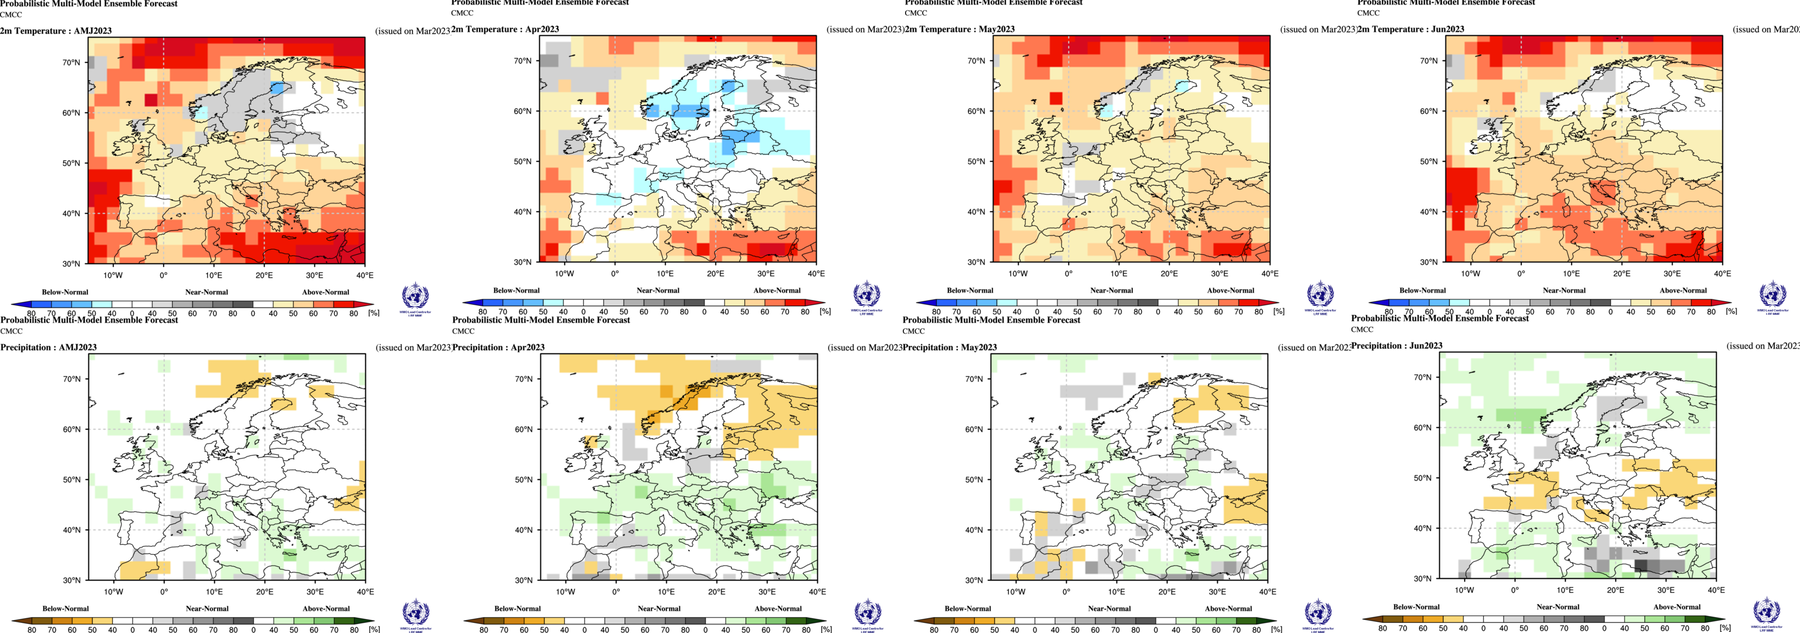
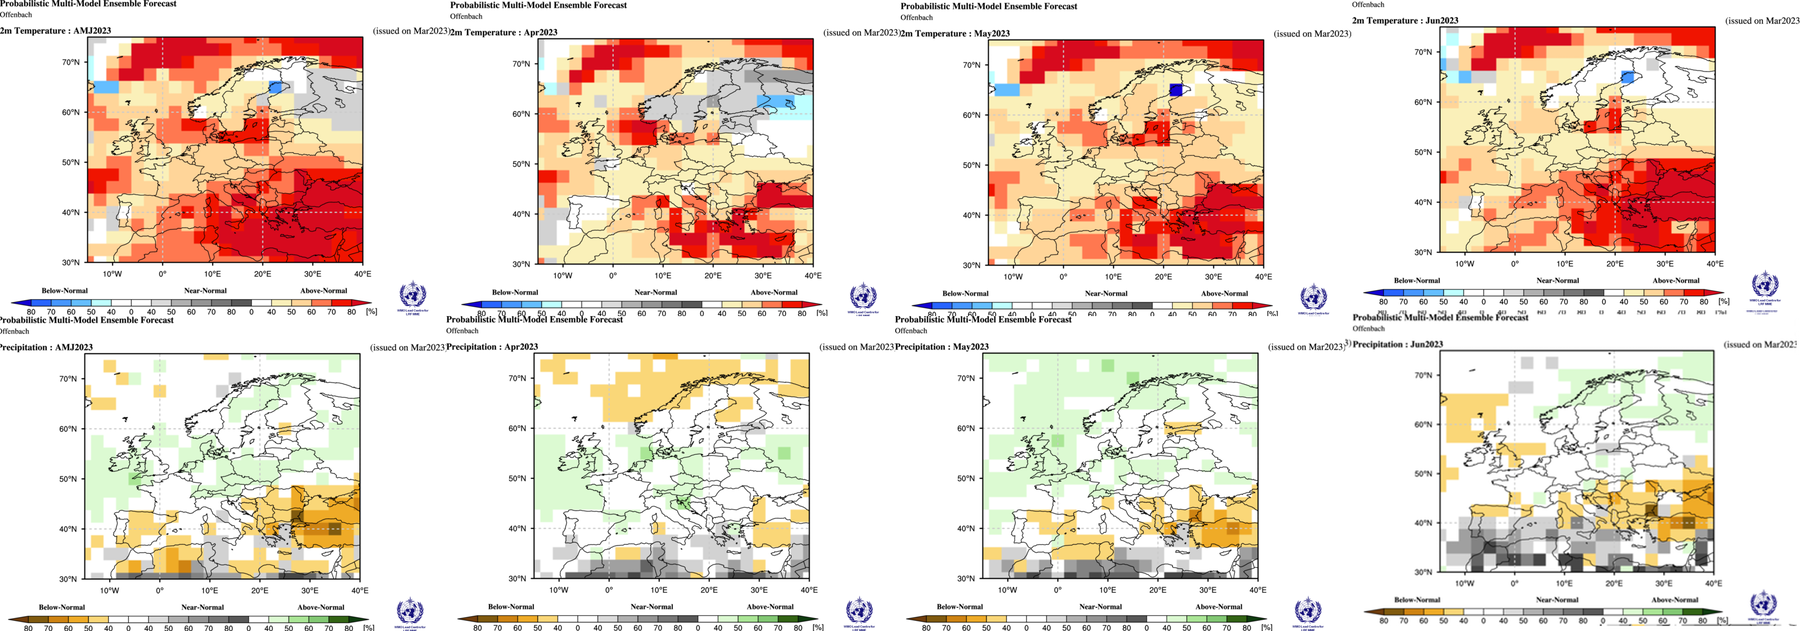
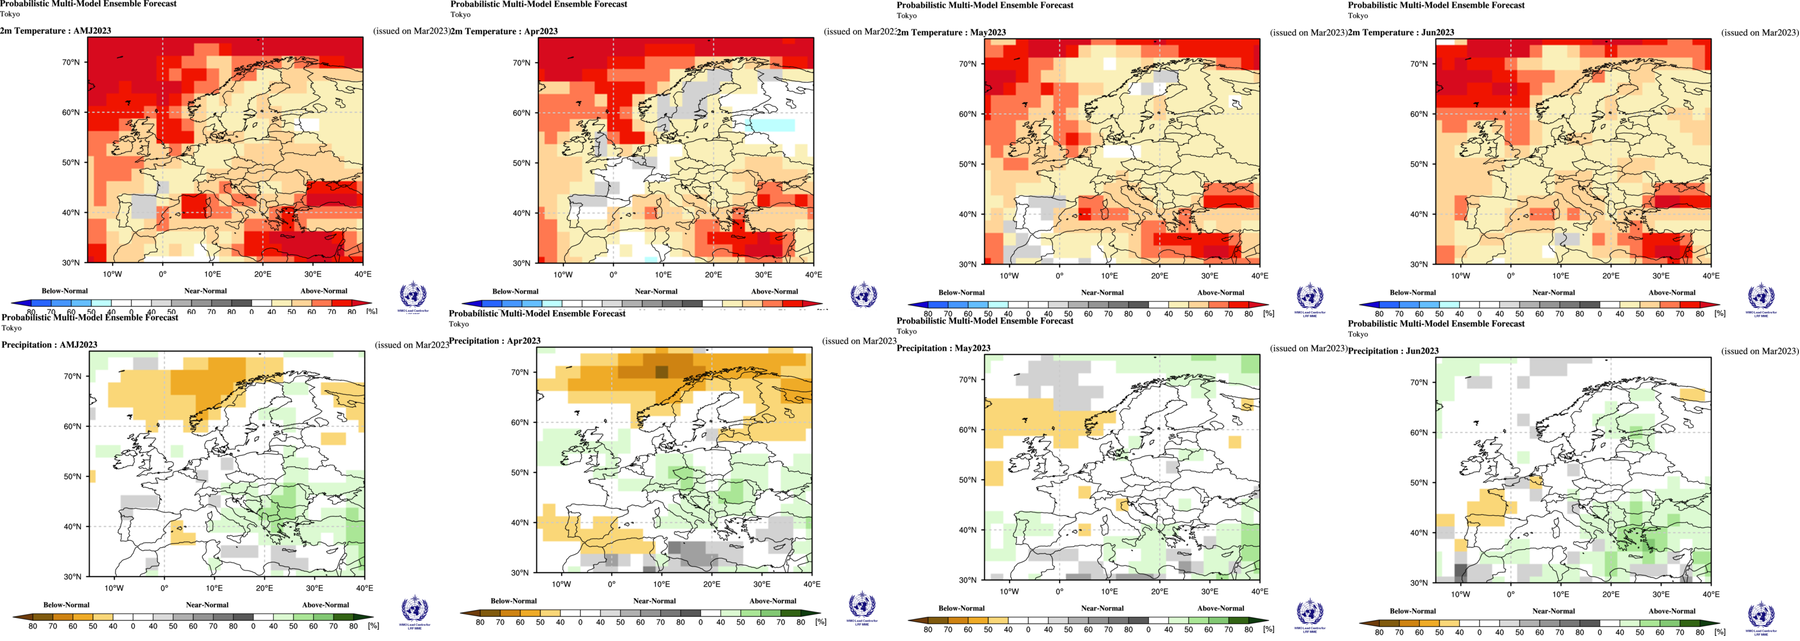
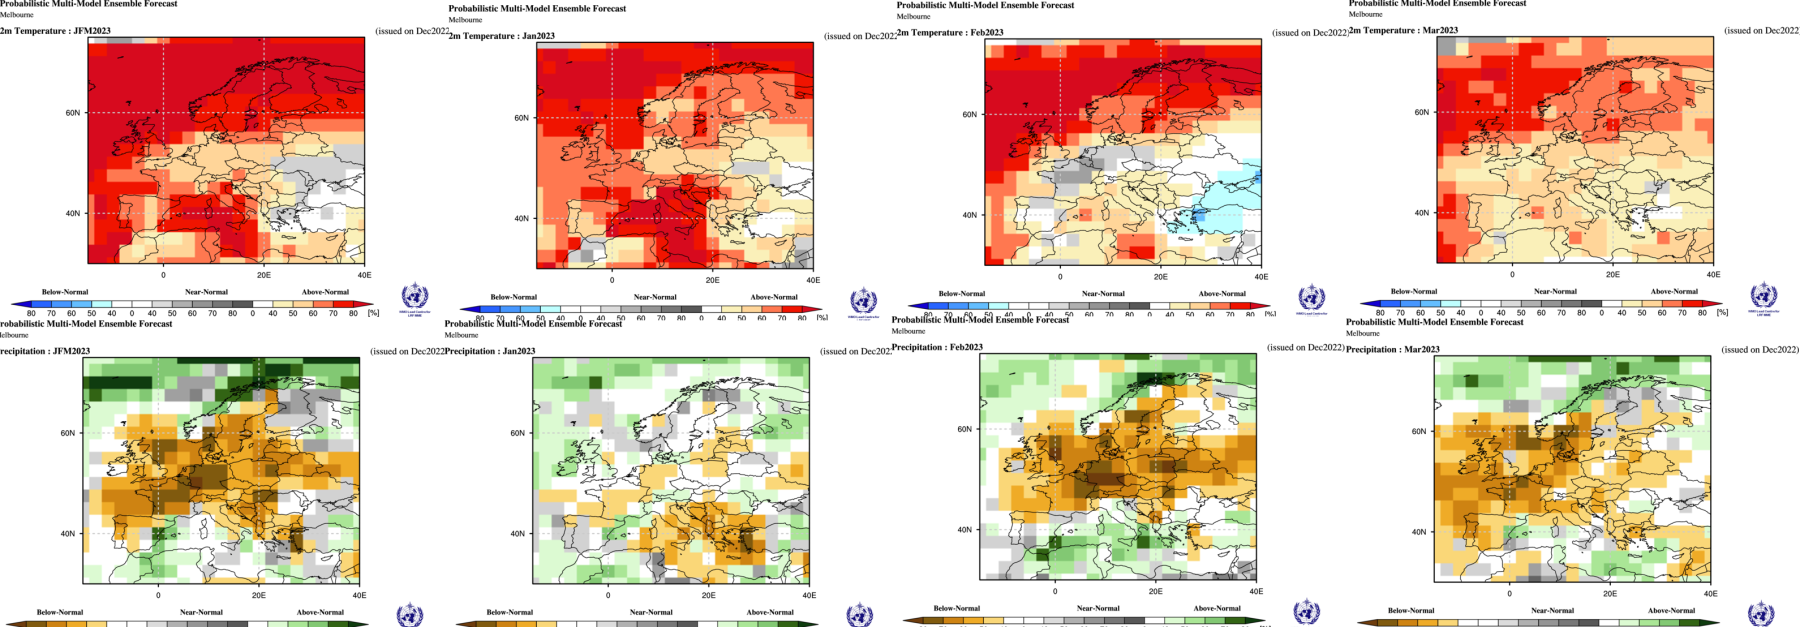
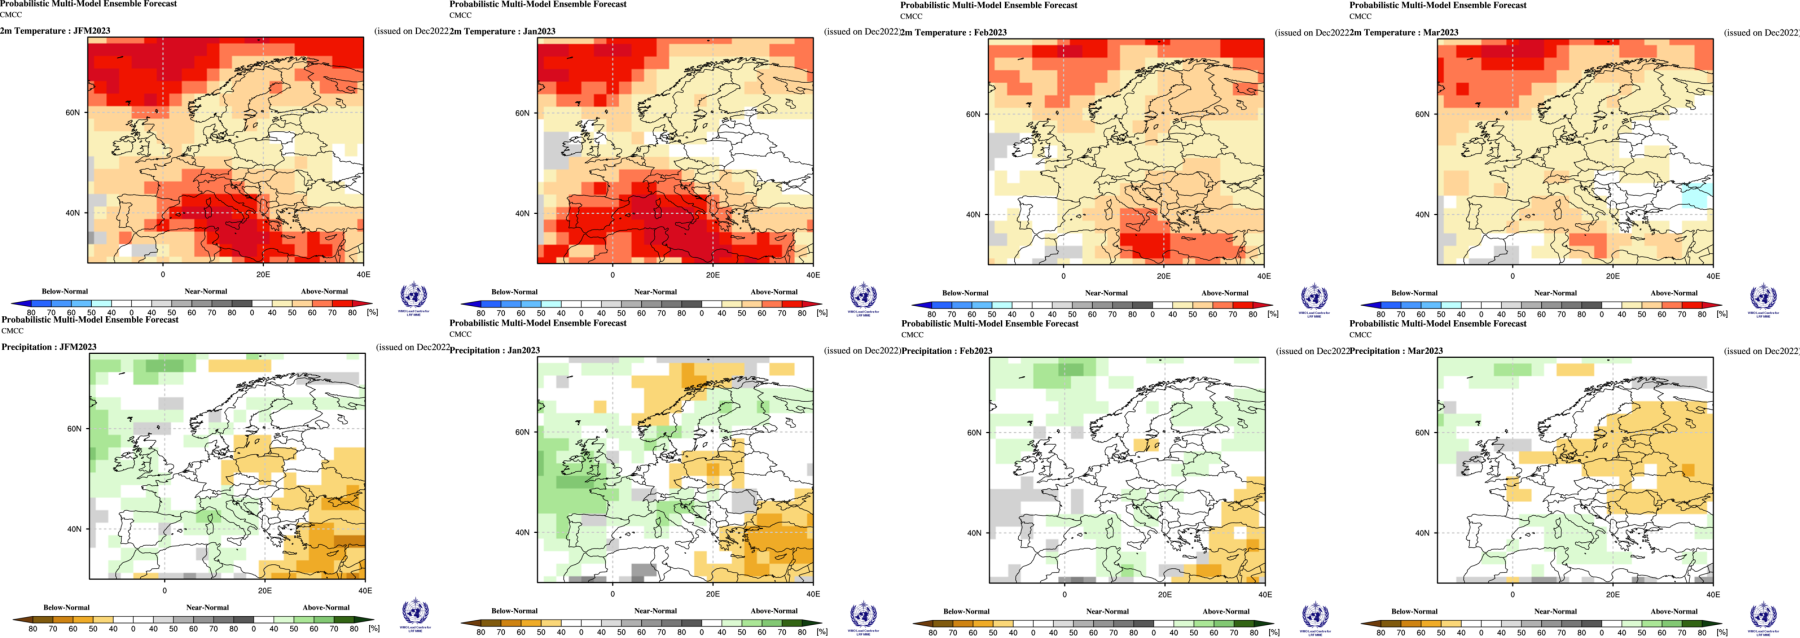
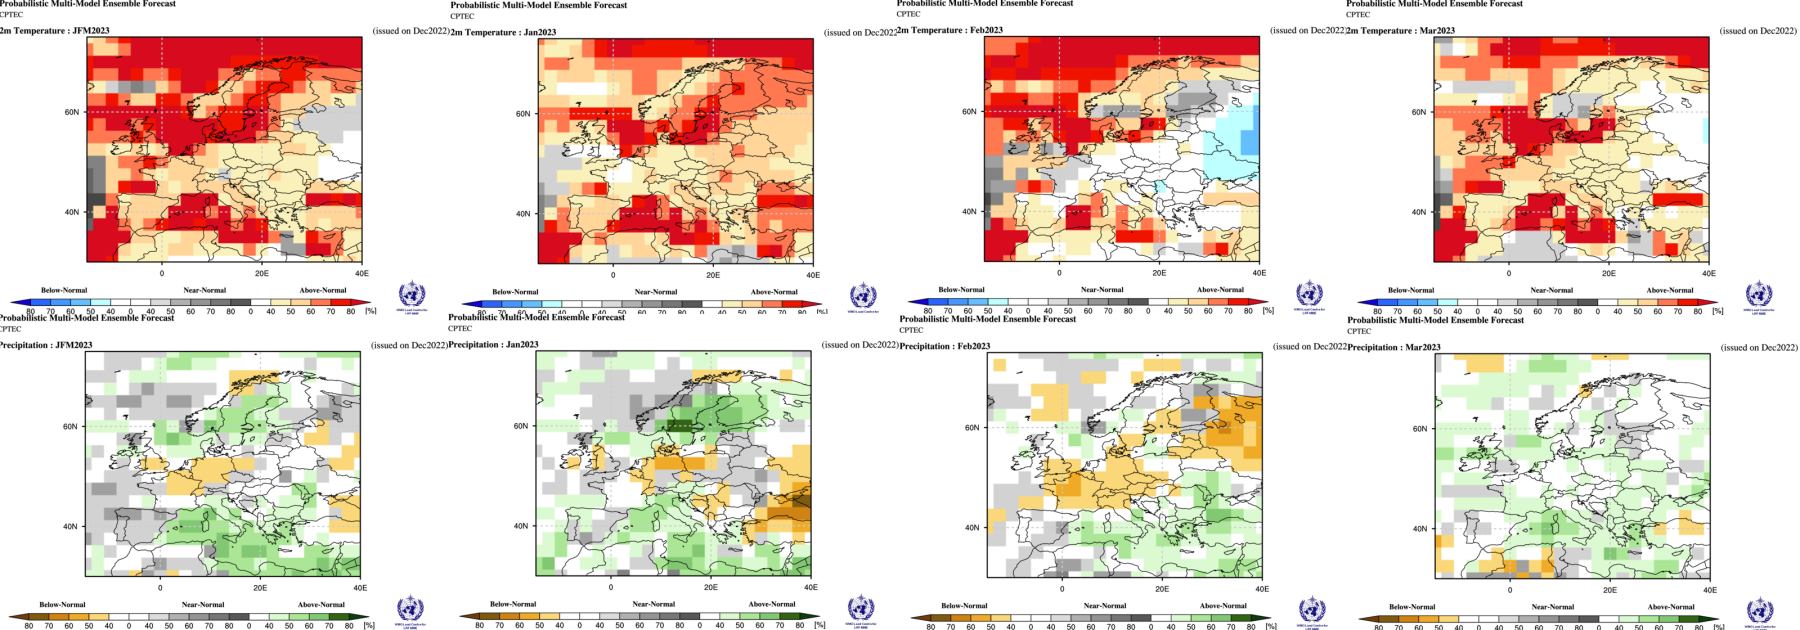
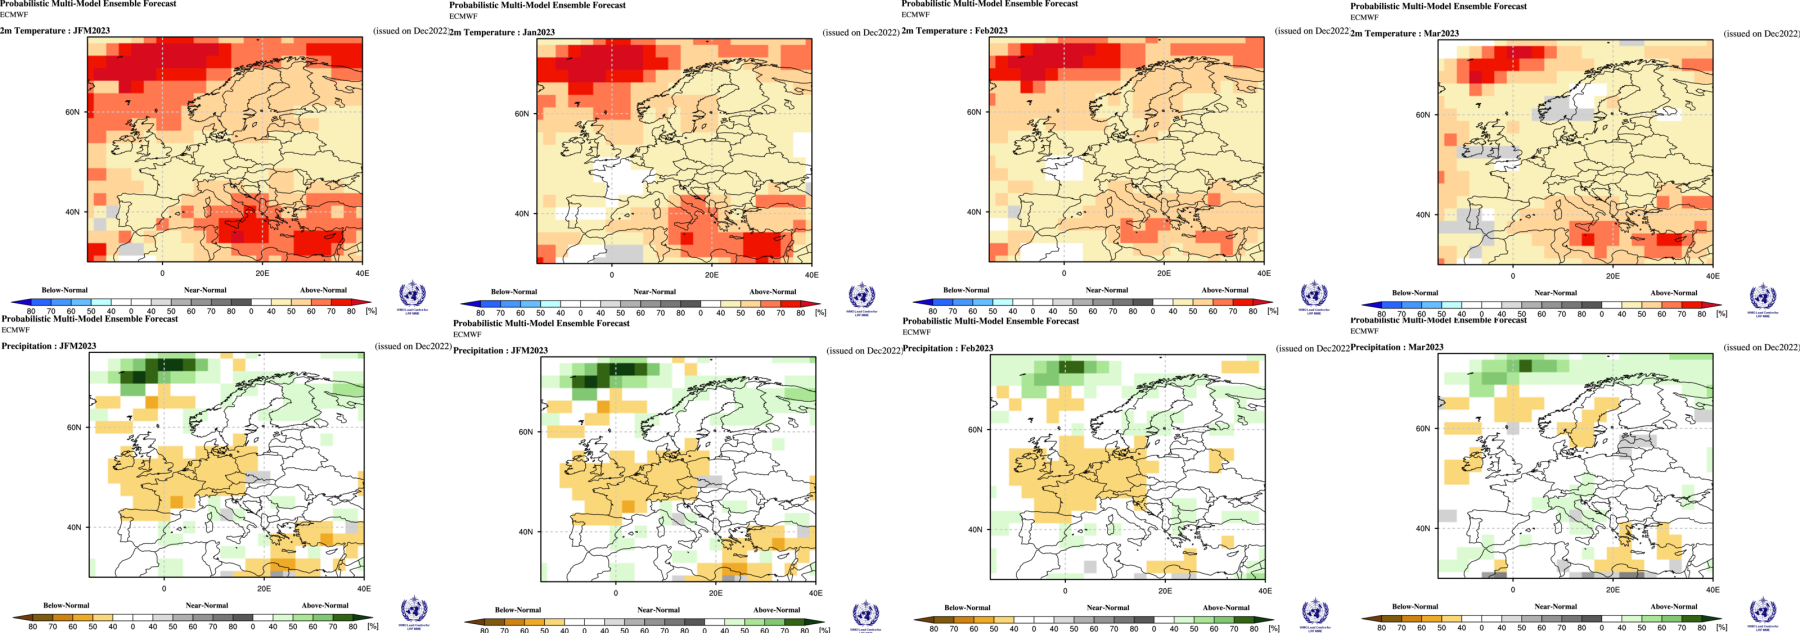
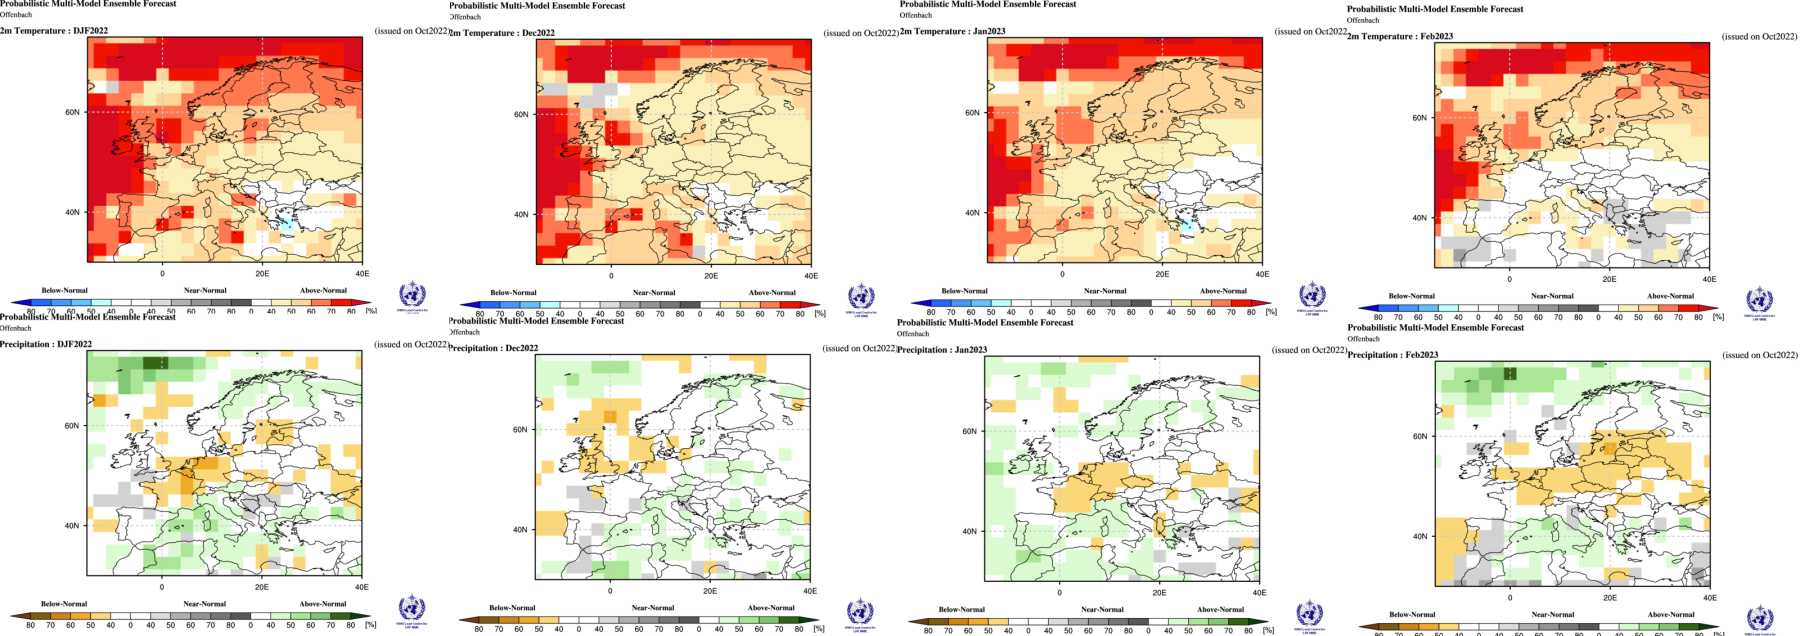
Individual members of the WMO super ensemble are shown below.


Russia


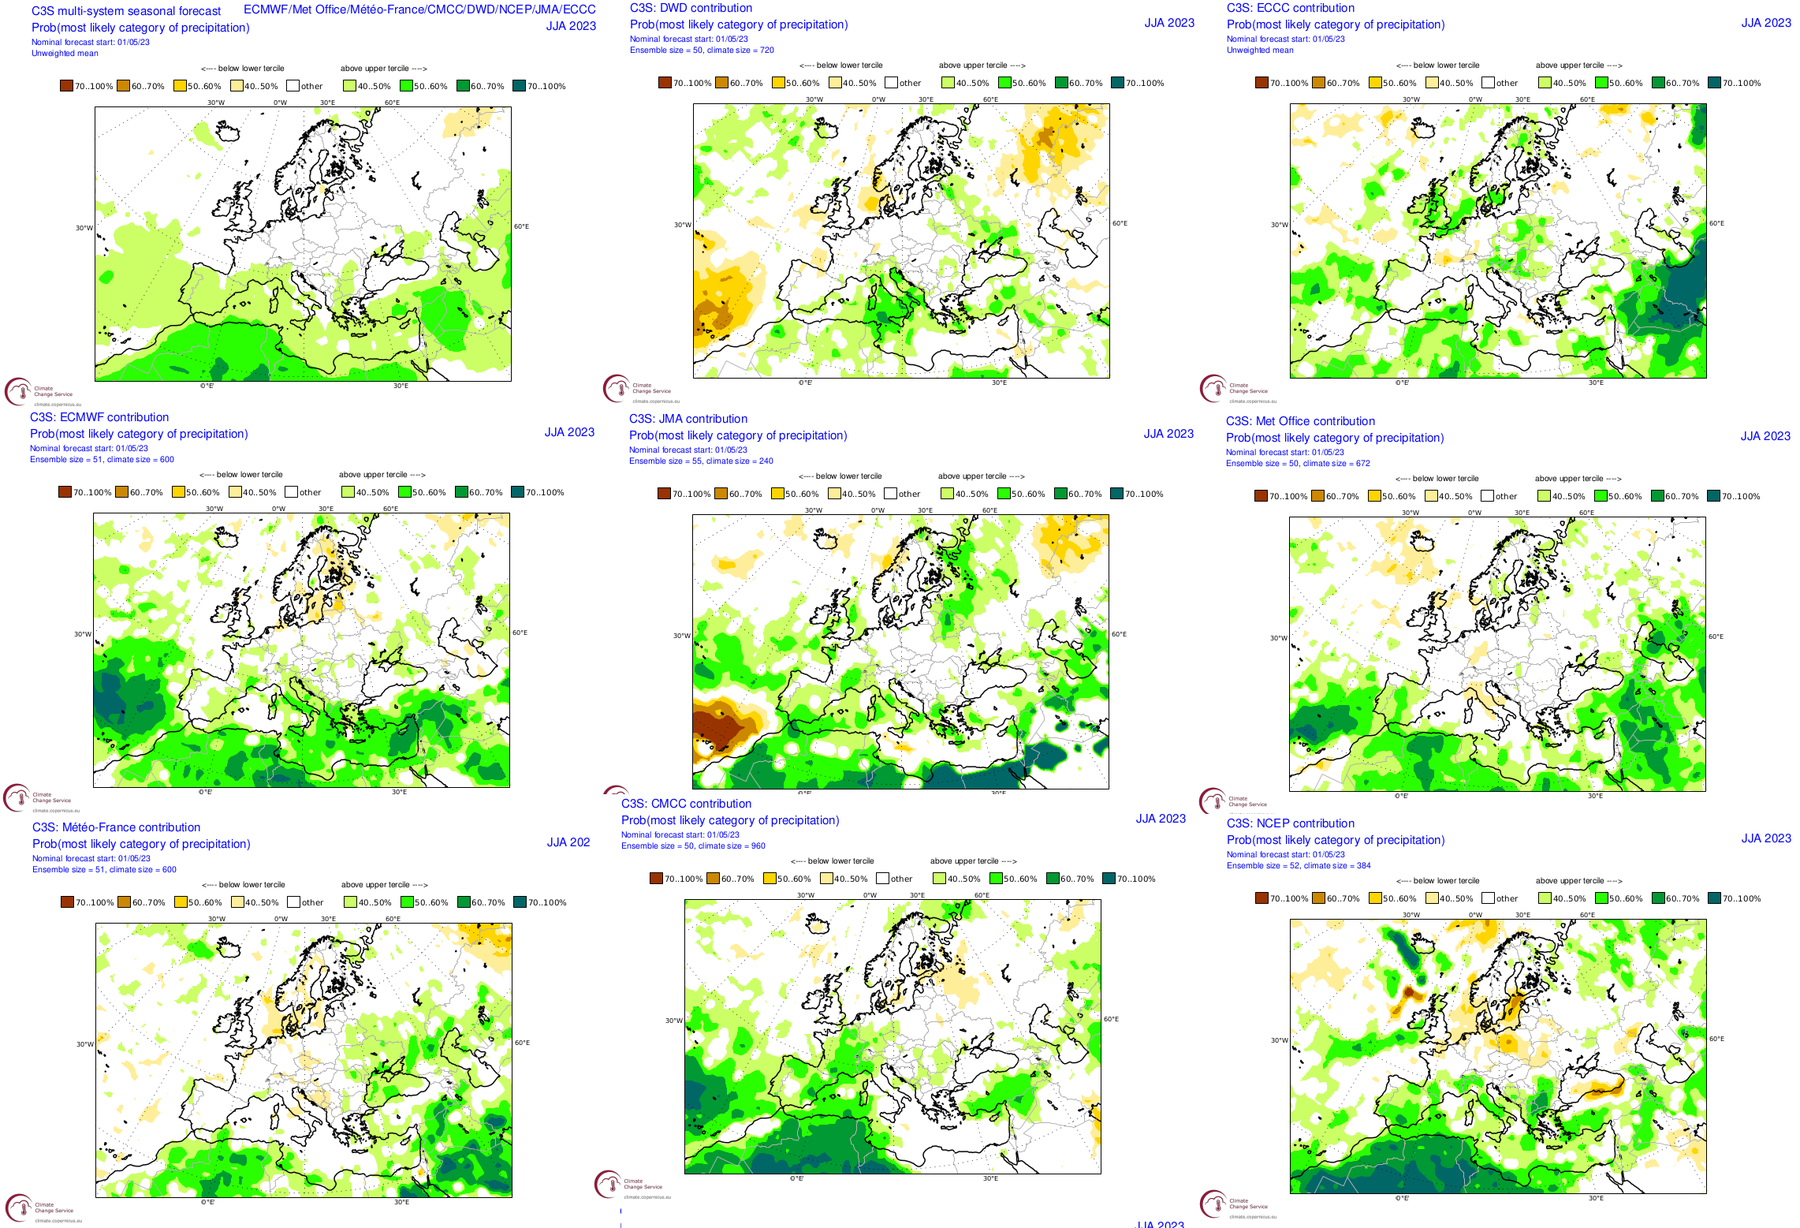
Copernicus C3S multi model ensemble. Less models than used in the WMO version but at higher resolution. data is available on a month by month bases but this detail often proves unreliable especially with regards to precipitation so here just the three month average anomalies are shown. The C3S is the combined multi model ensemble.


C: Comparing previous output:
March to May 2023 – based on February 2023 data.
Observed data.
Temperature. above average when compared to 1961-1990 but near average 1991-2020 period
Rainfall. above average
Sunshine. above average except N Ireland
Pressure. near normal or slightly above, Below normal in March otherwise mostly above normal and strongly so in May.
Original Summary – 160223 –
Temperature : Strong indication for above average temperature values for Spring, although the size of the anomaly is less clear and values may be only slightly above average. Some hints at near average values in March due to possible colder spell for the S of England around Mid March but this is uncertain.
Rainfall: Slightly more models suggest below average rainfall for Spring but with a hint of above normal across the NW. Large spread of solutions with some suggest a wet March across the S and W of the UK. In the WMO superensemble works out near average as the wetter solutions cancel out with the drier ones.
Caution:
1: Due to large scale stratospheric warming out of the polar vortex there is increased uncertainty for the second half of March.
2: Large scale blocking with cold easterly types seem to only be forecastable about two weeks ahead.
Comment: Above average temperature forecast good (three month average). Rainfall poor buut suggestion of wetter March in south was good.
Scoring will attempt to state good, fair, poor or no signal.
Note du3 to averaging period in models hindcast being below closer to the 1991-2020 period this new period will after this period be used for verification.
1. Russia (WMO): Temp good . PPN poor.
2. USA – CFS2 : Temp good . PPN fair.
3. UKMO Contingency: Temp good . PPN fair.
4. UKMO : Temp good . PPN fair . PMSL fair
5. USA – IRI : Temp good. PPN poor .
6. KMA APCC : Temp good . PPN poor .
7. JMA : Temp good PPN fair . PMSL good
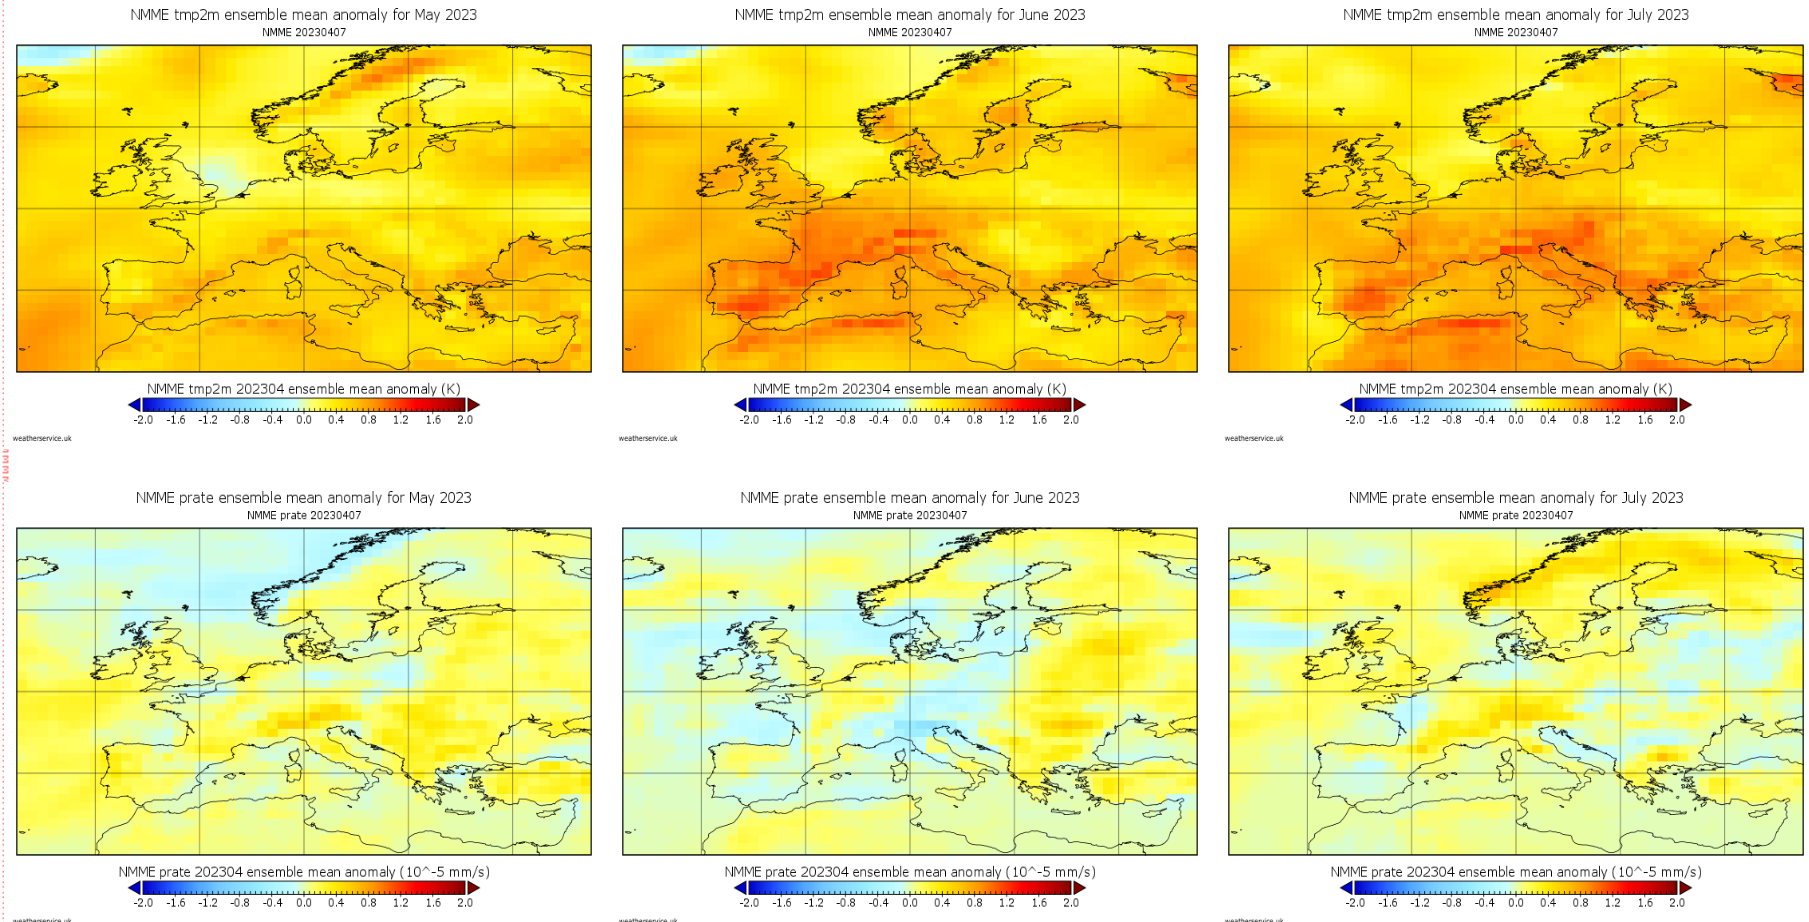
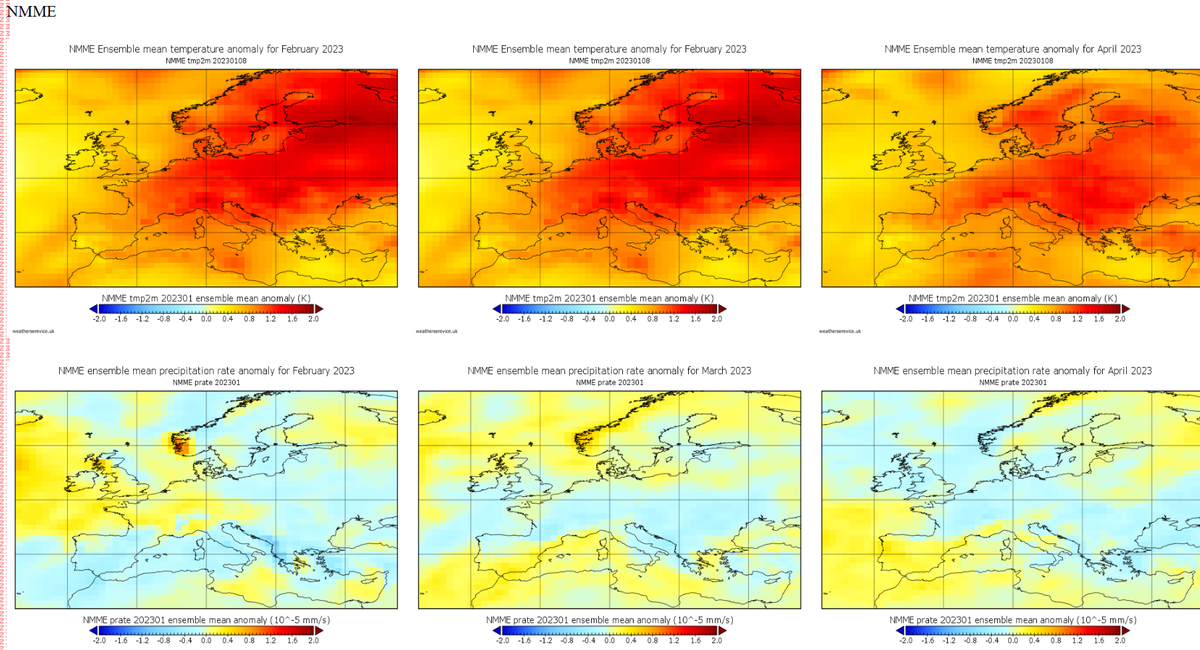
8. NMME : Temp good . PPN poor.
9. WMO multi : Temp good . PPN poor..
10. BCC : Temp good . PPN fair. .
11. NASA : Temp good . PPN poor .
12. CanSips : Temp good . PPN poor .
13. Copernicus Temp good . PPN poor . PMSL poor
14. CMCC Temp good . PPN poor . PMSL fair
15: DWD Temp good. PPN fair . PMSL fair
16. EC Temp good. PPN fair . PMSL fair
17 JMA Temp good. PPN poor . PMSL fair
18 UKMO Temp good . PPN fair . PMSL fair
19. MF Temp good. PPN poor . PMSL fair
20 NCEP Temp good . PPN fair . PMSL fair
21 ECCC Temp: poor . PPN poor . PMSL fair
WMO low res data:
WMO low Temp good . PPN poor .
BoM Temp good . PPN fair .
Can Temp good. PPN poor .
DWD Temp good. PPN fair .
KMA Temp good. PPN poot .
MOSC Temp fair . PPN fair .
WASH Temp good . PPN poor .
CMA Temp good. PPN poor .
ECMWF Temp good . PPN fair .
UK Temp good. PPN poor .
JMA Temp good. PPN poor
MF Temp good. PPN fair .
CMCC Temp good. PPN poor .
CPTEC Temp good. PPN poor.
D: Text Forecast for SW England
Remainder of Summer 2023 (July August)
Temperature: Overwhelming indication for above or well above average temperatures for the season and each month.
Rainfall: Mixed signals. Above average more likely than below average in northern and western parts of SW England, elsewhere normal perhaps below normal but could be made above normal by local thunderstorm rainfall. Uncertain as to whether above average rain relates to more wet days or just shorter spells of heavier rain with fewer wet days compared to average.
Summer climate: 1981 to 2010 average daily mean temperature 14 or 15°C in many areas to 16 or 17°C in main urban areas also locally east of the moors and more widely in Somerset. Maximum temperatures average 19 to over 21°C in similar areas. July often warmer than August. Average 1981 to 2010 rain 300mm over the moors, typically 200 to 250mm in many coastal and eastern areas. July often drier than August.
Autumn 2023 (September October November)
Temperature: Milder than average Autumn is most likely, consistent across models. Slightly reduced anomalies in November.
Rainfall: Probably wetter than average for the season. Month to month detail unreliable but suggestion of drier start and wetter October/November.
Autumn climate: 1981 to 2010 average mean temperature 11 or 12°C but nearer 10°C in rural areas. Maximum temperatures average 14 to 16°C. November normally colder than October which is colder than September. Average 1981 to 2010 rain 300 to 400mm, 600 to 800mm over the moors but east of the moors and in lowland Somerset more like 200 to 300mm. September often drier than October or November.
Winter (December 2023 January and February 2024) limited data
Milder than normal for the season and each month. Average or above average precipitation in December and then average perhaps below. Overall wetter than average season. Snowfall likely to be below average.
Winter Climate: 1981-2010 average temperature values for lowland areas 7°C in the West and 5°C in the East. Rainfall; Dec and Jan typically wetter than February. 1981-2010 Autumn average 300-400 mm lowlands but 200-300 mm areas to E of Dartmoor. Snow climatology less than 5 days lying snow over lowland areas 5 to 10 hills, say hills around 200 metre elevation – one in three years have no lying snow.
E: Caution.
Experimental Long Range Forecasts do not have a good success rate, especially with regards to precipitation. The models are good at predicting above average values but not for picking out a one off colder month. The data used for the above forecast summary can be seen at here.
The attempt at a Regional Forecast for SW England aims to test whether such a forecast of temperature and rainfall variation from average can be made using numerical model data available on the internet. The forecast should not be used for any other purpose. A brief verification summary for the UK and Eire is routinely published at http://www.weather-info.co.uk/wxsvc/Verification.html or Click here for the Teignmouth and Dawlish summary
F: References.
SST anomaly NOAA Remote Sens. 2014, 6(11), 11579-11606; doi:10.3390/rs61111579
IRI statistics: Mason, S.J. and L. Goddard, 2001: Probabilistic precipitation anomalies associated with ENSO. Bull. Amer. Meteor. Soc., 82, 619-638.
UK climate details see: http://www.metoffice.gov.uk/public/weather/climate/
NMME information: http://journals.ametsoc.org/doi/abs/10.1175/BAMS-D-12-00050.1
CFS2 info
GLOFAS Acknowledgement: Data were provided by the Global Flood Awareness System – GloFAS (http://www.globalfloods.eu/) of the European Commission Joint Research Centre and the European Centre for Medium-Range Weather Forecasts.
Reference: Alfieri, L., Burek, P., Dutra, E., Krzeminski, B., Muraro, D., Thielen, J., and Pappenberger, F.: GloFAS – global ensemble streamflow forecasting and flood early warning, Hydrol. Earth Syst. Sci., 17, 1161-1175, doi:10.5194/hess-17-1161-2013, 2013.
‘Copernicus Products’ as listed in the C3S or CAMS Service Product Specification or any other items available through an ECMWF Copernicus http://climate.copernicus.eu
International seasonal monthly data from WMO
Climate data from The Met Office UK and NCEP USA
Contains public sector information licensed under the Open Government Licence v3.0.